
- Chainlink has rebounded slightly after falling to a two-year low near $6.99.
- Wallet growth and ETF inflows suggest long-term confidence is still building.
- LINK must reclaim key resistance near $8.31 and $9.04 before a stronger recovery can take shape.
Chainlink is trying to steady itself after a rough stretch. LINK was trading near $8.00 on Tuesday, showing a small recovery after falling to a two-year low of $6.99 over the weekend. The bounce has given traders something to watch, but the bigger picture is still mixed, especially after months of heavy losses and weak momentum across the broader crypto market.
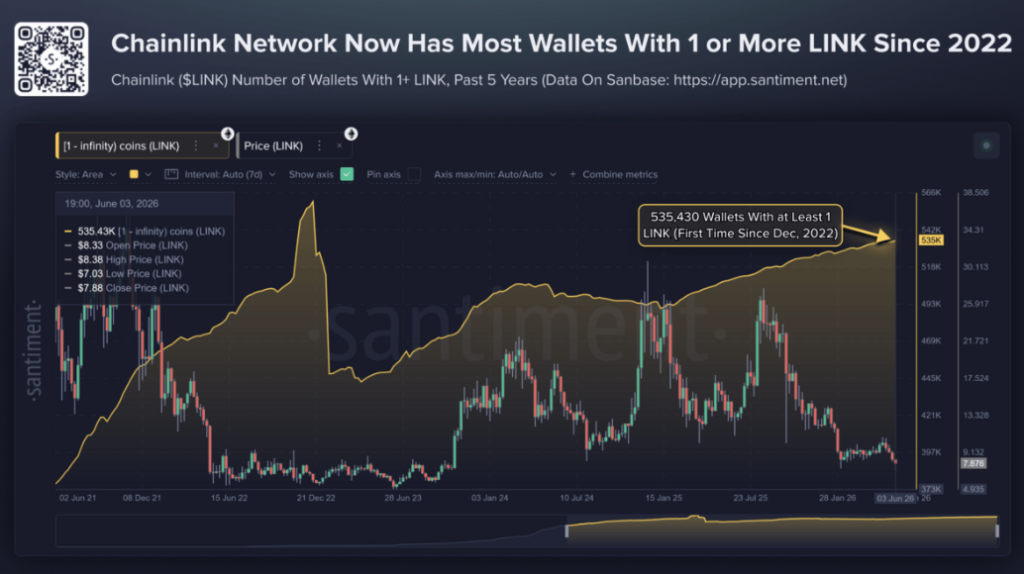
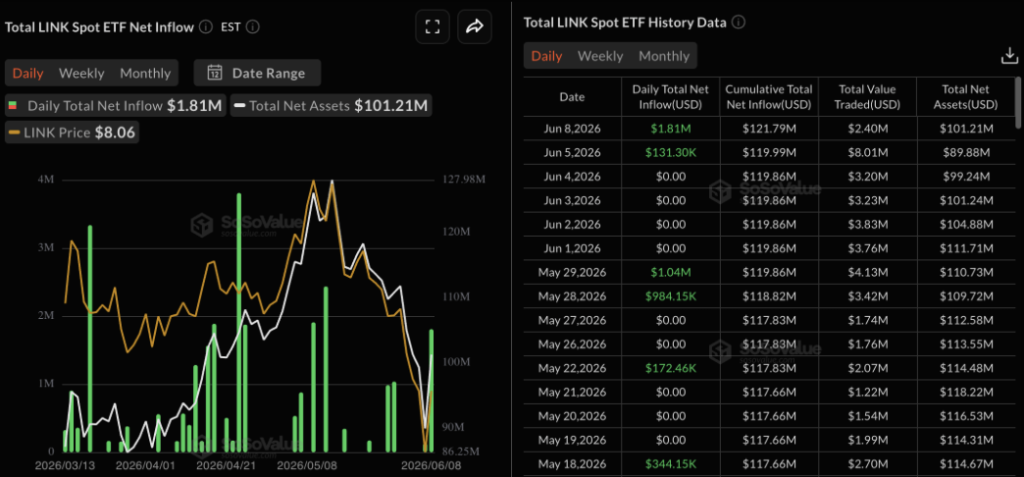
Even so, not all of the data looks bearish. Chainlink continues to show signs of ecosystem growth, with more wallets holding at least 1 LINK than at any point since December 2022. Add in fresh institutional inflows of about $1.81 million, and the long-term outlook starts to look more constructive, even if the short-term chart still feels fragile.
Chainlink Adoption Keeps Growing
Chainlink has struggled below the $10 level since February after posting six straight months of losses totaling more than 60%. That kind of decline would normally shake confidence, and to some extent, it has. But on-chain data suggests the community has not disappeared.
According to Santiment, the number of wallets holding at least 1 LINK reached 535,650 on Monday. That marks the highest level in more than three years. Smaller wallets do not usually control price direction on their own, but steady growth in this group can point to broader adoption and slow accumulation.
This matters because Chainlink remains one of the key infrastructure projects in crypto. Its oracle services help connect blockchains with real-world data, while its role in tokenized assets and real-world asset infrastructure keeps it relevant beyond simple market speculation. So while the price looks weak, the network itself is still drawing attention.
Institutional Inflows Support the Long-Term Case
Institutional demand is also adding some support to the outlook. LINK-focused ETFs recorded $1.81 million in inflows on Monday, bringing total net assets to about $101.21 million. Notably, these ETFs have seen zero outflows since launching on December 2.
That does not mean LINK is guaranteed to rally, of course. But consistent inflows during a weak market suggest that some larger investors are still building exposure. For a token that has spent months under pressure, that kind of quiet accumulation is worth noting.
The contrast is clear. Retail sentiment remains cautious, the chart still looks heavy, yet institutional flows and wallet growth are pointing in a more patient direction.
Derivatives Traders Remain Split
The derivatives market shows a more uncertain picture. According to CoinGlass, LINK futures Open Interest rose more than 4% over the past 24 hours to $373.06 million. That suggests traders are stepping back into the market and taking on more risk.
Funding rates also moved slightly positive, rising to 0.0024% after dipping negative the previous day. On the surface, that points to mild bullish sentiment. Still, the liquidation data tells a different story. Over the past 24 hours, total liquidations reached about $269,290, with long liquidations accounting for $195,880 of that amount.
That means bullish traders have been getting squeezed as LINK struggles to hold above $8.00. The market wants to recover, maybe, but it has not yet shown enough strength to reward aggressive long positions.
LINK Still Needs a Breakout
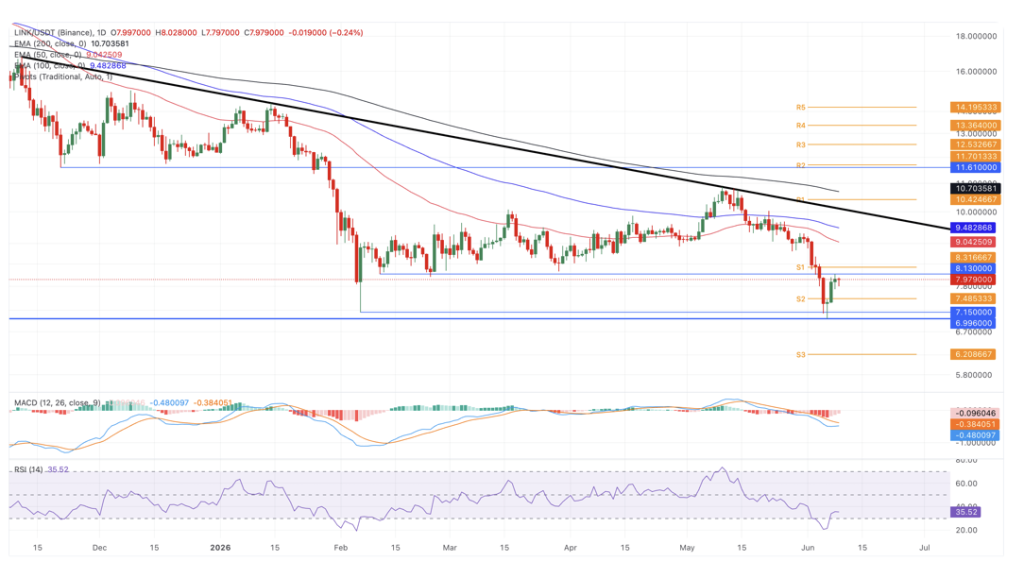
From a technical perspective, Chainlink remains under pressure. The token is trading below its key moving averages, with the 50-day EMA near $9.04 and the 100-day EMA around $9.48. The 200-day EMA sits even higher near $10.70, creating another major cap for any larger recovery attempt.
LINK is also still trapped below a long-term resistance trendline drawn from the highs of November 11 and January 14. Until that structure breaks, the broader trend remains tilted to the downside.
There are some early signs of selling pressure easing. The daily RSI has recovered to around 35 after moving up from oversold levels. However, the MACD remains below zero, and the negative histogram suggests bears are still in control for now.
Key Levels Traders Are Watching
The first major upside level sits near $8.13, close to the February 11 low that has now turned into resistance. A stronger move above that area, especially near the $8.31 pivot zone, could open the door for a test of the 50-day EMA at $9.04.
On the downside, the $7.48 pivot level is the first support to watch. If LINK breaks below that zone, traders may look toward the February 6 low near $7.15 and the recent low at $6.99.
For now, Chainlink is sitting in a difficult but interesting spot. Adoption metrics and institutional inflows are improving, yet price action still needs confirmation. Until LINK breaks above nearby resistance, the recovery remains more of a cautious rebound than a full trend reversal.