
- Analysts increasingly believe Bitcoin’s four-year cycle remains intact despite ETF-driven institutional adoption.
- The 200-week Moving Average model is flashing signals that previously appeared near major bear market lows.
- Weak demand remains a risk, but some analysts expect Bitcoin to form a cycle bottom later in 2026 before the next bull run begins.
For years, one of the most debated topics in crypto has been whether Bitcoin’s famous four-year cycle would eventually break. The introduction of spot Bitcoin ETFs, growing institutional participation, and broader market maturity led many investors to believe the old patterns might no longer apply.
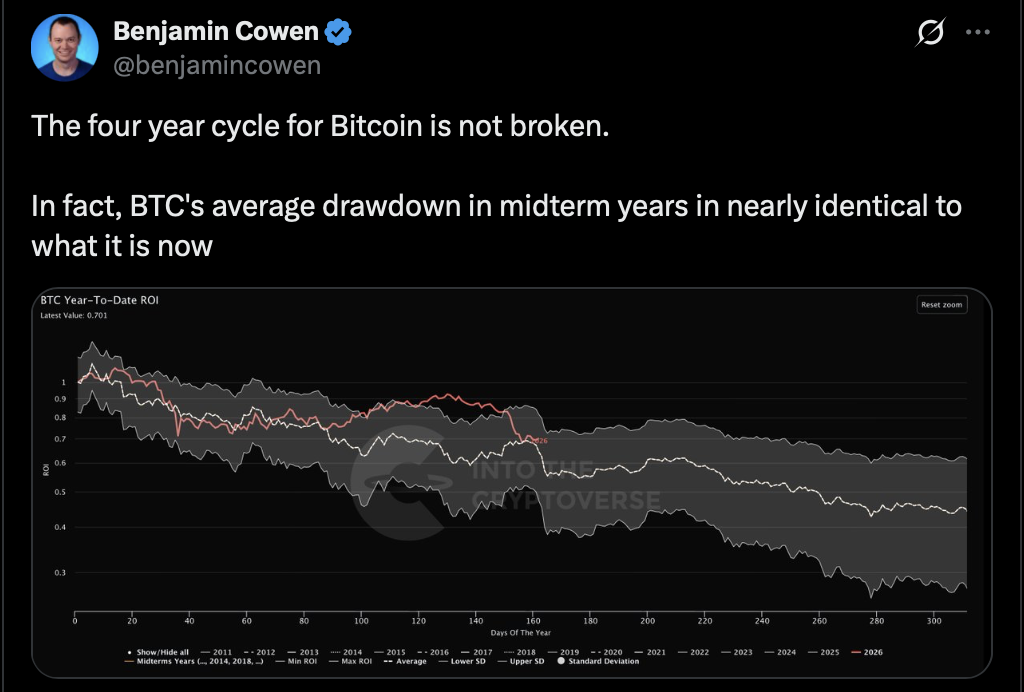
Yet as 2026 unfolds, a growing number of analysts are arriving at the opposite conclusion. Rather than breaking down, Bitcoin appears to be following its historical cycle surprisingly closely. The latest voice to support that view is crypto analyst Benjamin Cowen, who argues that the current correction looks remarkably similar to previous mid-cycle declines that occurred after past halving events.
According to Cowen, Bitcoin’s average drawdown during historical midterm years is nearly identical to what investors are witnessing today. In other words, the current pain may feel severe, but it isn’t particularly unusual when viewed through the lens of previous market cycles.
The Four-Year Cycle Refuses to Die
One reason many traders expected a different outcome this time was the arrival of U.S. spot Bitcoin ETFs in 2024. The products opened the door to unprecedented institutional access, leading some market participants to believe Bitcoin had entered an entirely new phase of adoption.
The assumption was simple: more institutional money should smooth out volatility and potentially eliminate the dramatic boom-and-bust patterns that have defined Bitcoin for more than a decade.
So far, that theory hasn’t held up particularly well.
Instead, Bitcoin’s behavior continues to resemble prior cycles. Large drawdowns have appeared after euphoric rallies, sentiment has swung from optimism to fear, and on-chain metrics are beginning to flash signals that have historically emerged near major market lows.
A Key Bottom Indicator Is Back in Focus
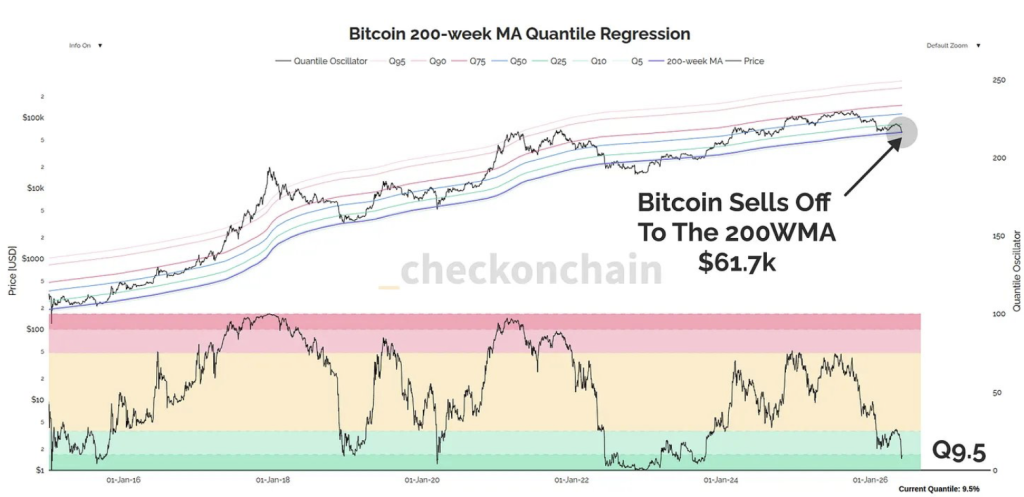
One of those signals comes from Bitcoin’s 200-week Moving Average model, often viewed as one of the most important long-term indicators in crypto.
According to on-chain analyst Checkonchain, Bitcoin has once again approached its 200-week Moving Average Quantile, a valuation zone that has historically aligned with some of the deepest stages of prior bear markets. The model measures where Bitcoin is trading relative to its long-term 200-week average and compares that position against historical data.
Current readings place Bitcoin within the bottom 10% of all historical observations.
That’s significant because similar readings have only appeared during major market bottoms in previous cycles. While no indicator can perfectly predict future price action, the metric suggests Bitcoin is entering territory that has historically attracted long-term buyers.
Demand Remains the Biggest Concern
Despite the encouraging signals from valuation models, not all the data points in the same direction.
CryptoQuant recently highlighted a sharp deterioration in Bitcoin demand, arguing that market conditions remain unfavorable for a sustained recovery. According to the firm’s latest research, total Bitcoin demand, including both futures speculation and spot market activity, contracted by approximately 652,000 BTC last week.
That represents the largest demand decline since January 2022.
Weak demand creates a difficult environment for any asset, even one with strong long-term fundamentals. Without sufficient buying pressure, prices often struggle to establish durable recoveries. That’s why some analysts continue to warn that Bitcoin could revisit lower levels before finding a definitive bottom.
Could Bitcoin Fall Below $60,000 Again?
The possibility remains very much on the table.
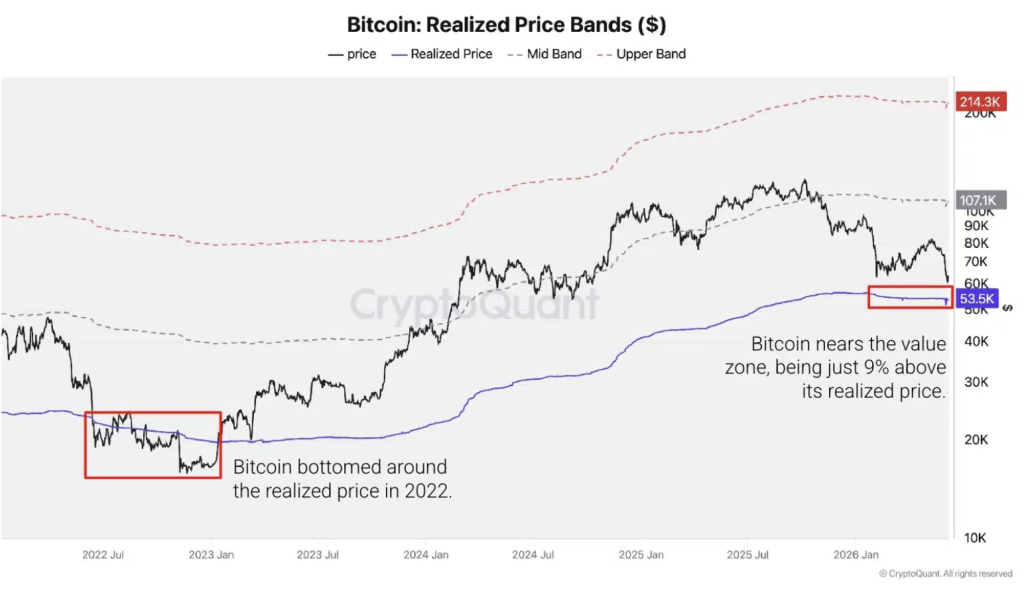
CryptoQuant noted that Bitcoin’s realized price currently sits near $53,500. Historically, this level has acted as a structural floor during major bear markets, including the 2022 cycle bottom. If market weakness continues and demand fails to improve, some analysts believe Bitcoin could eventually test that region.
That doesn’t necessarily mean a collapse is imminent. In fact, Bitcoin has already shown signs of stabilization after retesting its February lows. At the time of writing, BTC trades around $63,000 and has managed to recover modestly from recent weakness.
Still, the market remains in a fragile state. Investors appear cautious, liquidity conditions remain challenging, and conviction has yet to fully return.
The Next Bull Run May Begin With This Bottom
If Bitcoin continues following historical patterns, the current period could represent the final stages of the bear market rather than the beginning of something worse.
Previous cycles often produced their most convincing bottoms several months after the initial wave of panic. Based on that framework, some analysts believe Bitcoin could establish its true cycle low during the third or fourth quarter of 2026.
That timeline would also align with the early phase of the next bull market cycle.
Of course, history never repeats perfectly. External factors such as interest rates, regulatory developments, macroeconomic conditions, and institutional behavior can always alter the path. Even so, the growing alignment between Bitcoin’s current structure and previous cycles is becoming harder for market observers to ignore.
For now, the data presents a fascinating possibility. The four-year cycle many believed was dead may simply be doing what it has always done, testing investor patience before the next chapter begins.