
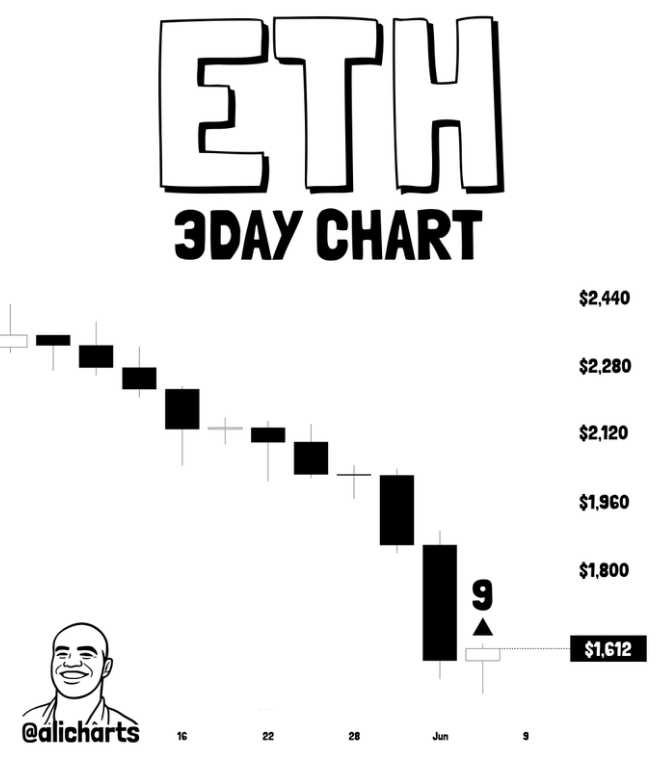
- Ethereum has printed a TD Sequential “9” buy signal after falling roughly 30% from recent highs.
- Exchange reserves continue declining, reducing the amount of ETH available for immediate sale.
- Both technical and on-chain indicators suggest the $1,600 level could become an important support zone for a potential recovery.
Ethereum may finally be showing signs that the relentless selling pressure of recent weeks is beginning to fade. After falling from above $2,300 to near the $1,600 level, ETH has printed a notable technical signal that some traders believe could mark the early stages of a recovery.
The signal comes from the TD Sequential indicator, a tool designed to identify trend exhaustion. On Ethereum’s three-day chart, the indicator recently completed a “9” buy setup after a prolonged sequence of bearish candles. While that doesn’t guarantee an immediate reversal, it does suggest that sellers may be running out of momentum after driving prices lower for an extended period.
At the same time, on-chain data is painting a similarly interesting picture. Exchange reserves continue moving lower, reducing the amount of ETH readily available for sale. When combined, these developments create a narrative that could support a short-term bounce, provided broader market conditions cooperate.
Ethereum’s Selloff May Be Approaching Exhaustion
The recent decline has been difficult for Ethereum holders. Over the past several weeks, the asset has established a clear pattern of lower highs and lower lows, reflecting persistent bearish sentiment across the crypto market.
From the $2,300 range to around $1,600, ETH has lost roughly 30% of its value. That’s a significant move, even by crypto standards. Yet steep declines often create conditions where trends begin to lose strength, and that’s exactly what the TD Sequential attempts to identify.
The indicator works by tracking a sequence of nine consecutive candles that each close lower than the candle four periods earlier. Once the count reaches nine, the market enters a zone where trend exhaustion becomes increasingly possible.
Crypto analyst Ali Charts recently highlighted this development, noting that Ethereum printed the buy signal and followed it with a small bullish candle. It’s not a confirmation of reversal, but it is the kind of behavior traders typically watch for when assessing whether sellers are losing control.
Key Resistance Levels Come Into Focus
If buyers can successfully defend the $1,600 support area, the next challenge becomes clear.
According to Ali Charts, Ethereum could attempt a recovery toward the $1,800 to $1,950 region. This zone represents a logical resistance area based on previous market structure and would likely become the first major test for any rebound attempt.
Of course, the opposite scenario remains possible.
Should ETH fail to maintain support around current levels, the broader downtrend could quickly reassert itself. Technical indicators can highlight potential turning points, but they don’t eliminate risk. That’s why many traders prefer waiting for additional confirmation before committing heavily to a new position.
For now, the signal suggests caution toward the bearish trend rather than outright bullish certainty.
Exchange Reserves Continue Moving Lower
While the chart is attracting attention, on-chain data may be providing an equally important clue.
Research shared by Rei Researcher points to continued declines in Ethereum exchange reserves, based on CryptoQuant’s “Ethereum Exchange Reserve – All Exchanges” metric. Although there was a brief increase in reserves earlier as some investors transferred assets to exchanges, that trend appears to have reversed once again.
This matters because exchange reserves represent the amount of ETH available for immediate sale on centralized trading platforms. When investors withdraw coins from exchanges and move them into private wallets, those assets become less likely to be sold in the short term.
Over time, declining exchange balances can reduce available sell-side liquidity and ease some of the pressure weighing on prices.
Holder Behavior Is Starting to Shift
The latest reserve data suggests many Ethereum holders are choosing storage over liquidation.
Rather than sending ETH to exchanges in anticipation of selling, a growing portion of investors appear comfortable holding through current market conditions. That shift may seem subtle, but it changes the supply dynamics around important support zones.
Simply put, fewer coins on exchanges means fewer coins immediately available to hit the market if volatility increases. While that doesn’t create demand on its own, it can help reduce downward pressure during periods of uncertainty.
For Ethereum, this trend becomes particularly relevant around the $1,600 area, which is increasingly emerging as a key battleground between buyers and sellers.
Technical and On-Chain Data Point to the Same Zone
What’s notable about the current setup is that both technical indicators and on-chain metrics are pointing toward the same conclusion.
The TD Sequential suggests selling momentum may be fading near $1,600. Exchange reserve data indicates holders are reducing available sell supply at roughly the same time. Neither signal guarantees a rally, but together they strengthen the argument that Ethereum may be building a foundation for stabilization.
Whether that foundation develops into a meaningful recovery will ultimately depend on broader market sentiment and the willingness of buyers to step in aggressively. For now, though, the data suggests the bears may no longer have the easy control they enjoyed during the recent slide.
And after weeks of relentless selling, that’s a development Ethereum investors will be watching very closely.