
- XLM is showing early recovery signs after breaking above a long-term descending trendline.
- The $0.20 to $0.205 zone is now a key support area for confirming the breakout.
- A move above $0.30 could strengthen the long-term bullish case, but market confirmation is still needed.
Stellar is starting to catch traders’ attention again after spending months under pressure. XLM has been stuck in a difficult downtrend for quite some time, but recent price action suggests the asset may be trying to shift direction. It is still early, though. The broader altcoin market remains uneven, and analysts are not yet calling this a full reversal.
Market watcher LSTRADER recently warned that patience may still be the best approach. While some altcoins have managed to hold their ground better than expected, he noted that the wider market has not shown enough strength to confirm a major trend change. In simple terms, XLM may be improving, but the market still needs more proof before bulls can get too excited.
XLM Attempts to Break Out After Long Decline
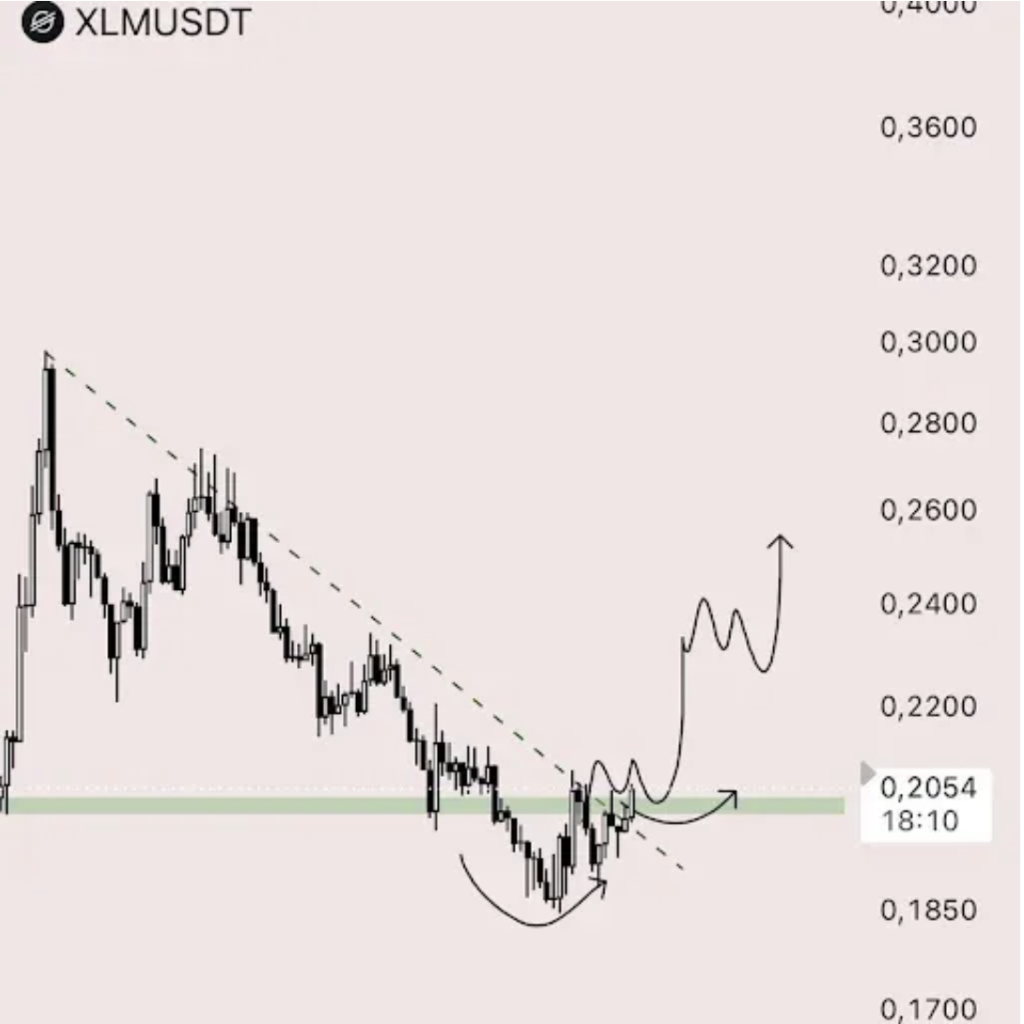
Stellar’s latest chart shows XLM trying to move beyond a long-term descending trendline that has controlled price action for months. During the decline, the asset kept forming lower highs and lower lows, giving sellers the upper hand and keeping momentum tilted to the downside.
That structure may now be starting to weaken. XLM formed what looks like a rounded bottom near the $0.185 level, a pattern that often suggests selling pressure is slowing while buyers begin stepping back in. After that, the price moved above the descending trendline and started testing the $0.20 to $0.205 area as a potential support zone.
This area matters. If XLM can hold above it, traders may begin viewing the breakout as more reliable. From there, the next upside targets sit around $0.23, followed by a possible move toward the $0.24 to $0.26 range. But if the token falls back below the breakout zone, the recovery setup could quickly lose strength.
Long-Term Pattern Keeps Bulls Interested
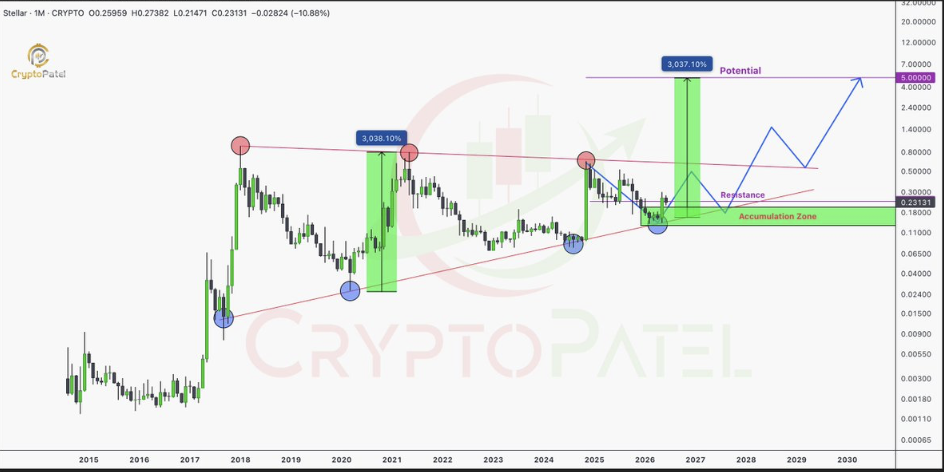
The longer-term view is also giving Stellar supporters something to watch. Crypto Patel recently pointed to a large symmetrical triangle pattern on XLM’s monthly chart, one that has been forming over several years. These patterns usually reflect a long period of accumulation before the market finally chooses a direction.
Historically, Stellar has produced major rallies after long consolidation periods. During the 2017-2018 and 2020-2021 cycles, XLM saw huge upside moves after extended base-building phases. Some traders believe the current structure could eventually lead to a similar breakout, assuming key support levels continue to hold.
The main support zone remains between $0.18 and $0.25, an area where buyers have shown interest before. On the upside, the $0.30 level is the major resistance to watch. A clean breakout above that zone could bring stronger bullish momentum back into the market.
Stellar Still Needs Confirmation
For now, Stellar is showing promise, but not certainty. The short-term breakout attempt is encouraging, and the long-term chart gives bulls a reason to stay interested. Still, XLM remains heavily tied to overall crypto market sentiment.
If buyers defend the $0.20 region and push above $0.23, the recovery case becomes stronger. If not, the move could turn into another failed breakout, something traders have seen plenty of during weak market conditions.
Stellar may be entering a more interesting phase, but the market has not fully confirmed it yet. For now, patience remains key.