


- Bitcoin’s price has diverged slightly from the 2017 bull cycle, but correlation still holds strong at 91%.
- MVRV ratio and market behavior suggest BTC is in a correction phase similar to past bull markets.
- A 30-day lag analysis boosts the 2025–2017 cycle correlation to 93%, hinting at a potential rally ahead.
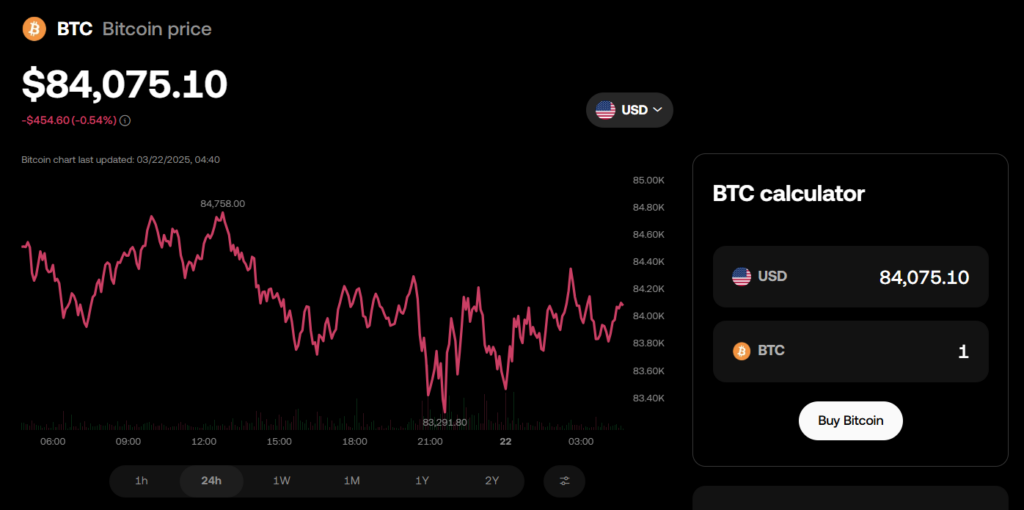
Bitcoin smashed through the $100K mark earlier this year, but lately? It’s been kinda slumping. After hitting that all-time high, the price has slid into a multi-week downtrend, and naturally, everyone’s wondering: Is BTC still tracking like it did during the legendary 2017 bull run—or has the pattern broken?
Comparing Bitcoin in 2025 vs. 2017
If you lay the charts side-by-side, BTC’s current run—from the 2022 bear market lows to now—looks eerily like the 2015–2017 cycle, the one that ended with Bitcoin hitting $20K in December 2017. But now, for the first time in this cycle, Bitcoin’s recent drop has pulled it off track. If it were still mimicking 2017, we’d be seeing higher highs, not this sideways chop and slide.
Still, even with this divergence, the correlation remains high. At the start of 2025, the current cycle had a 92% match with 2017. That’s slipped slightly to 91%—but honestly, that’s still freakishly high for financial market patterns.
MVRV Ratio Still Mirrors 2017
One important thing to watch is the MVRV Ratio, which compares current market price to the average price BTC holders paid. When it spikes, it means investors are deep in profit territory—usually just before things top out. When it drops toward the average, it suggests we’re near a market bottom.
Lately, the MVRV ratio has been dropping alongside BTC’s price, which matches how things played out in 2017 too. There were big rallies, followed by gut-check corrections. So even though the price itself is stumbling, the market psychology still lines up with 2017. Right now, MVRV’s correlation with 2017? Still around 80%.
The Lag Factor: Liquidity and BTC’s Delayed Reaction
Here’s where it gets interesting. Global liquidity (think: the total money supply) often leads Bitcoin’s price—but with a delay. Analysts have found it takes about two months for changes in global liquidity (like M2 money supply) to ripple into BTC.
Now, apply a 30-day lag to Bitcoin’s current price chart and compare it to 2017—and boom, the correlation shoots up to 93%. That’s the highest match recorded. So what looks like a breakdown might just be a delay. If that’s the case, BTC could soon get back on track and follow the 2017 pattern again.
So, What’s Next for BTC?
No one’s saying 2025 will be a carbon copy of 2017—but there’s a saying in markets: history doesn’t repeat, it rhymes. And so far, Bitcoin is still humming a very familiar tune.
If it keeps tracking with 2017—just on a little delay—we might be looking at a sharp recovery and a potential rally in the not-too-distant future. Hold tight, watch the charts, and don’t count BTC out just yet.


