
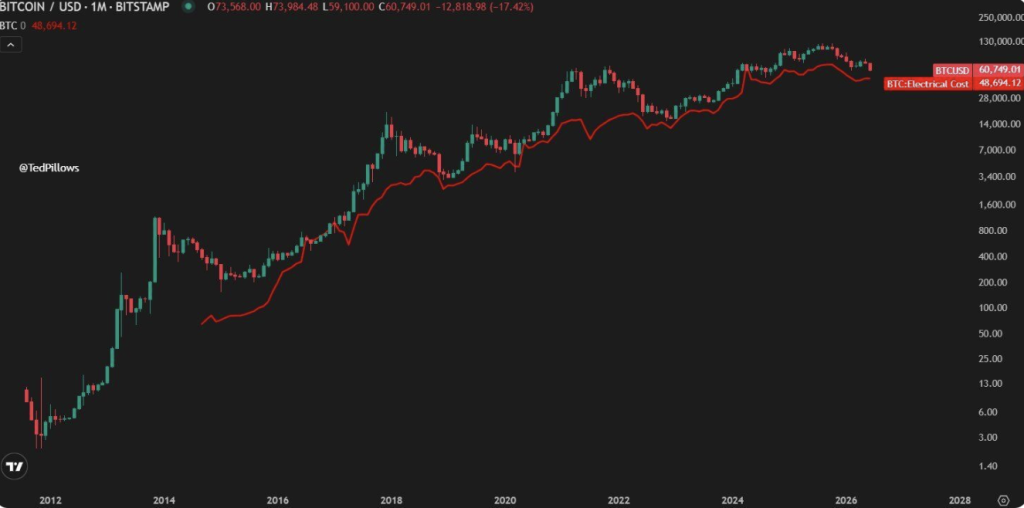
- Bitcoin’s Electrical Cost currently sits near $48,694 and has historically marked major bear market bottoms.
- Analysts view the metric as a strong long-term support level, though severe macro shocks could temporarily break it.
- A move below $54,000 may put the Electrical Cost floor in focus as Bitcoin searches for its cycle low.
Bitcoin has clawed its way back toward the $63,000 level after a modest rebound, yet the broader picture remains difficult to ignore. The world’s largest cryptocurrency is still trading roughly 50% below its record high, leaving investors searching for clues about where this bear market could ultimately find its footing. One metric drawing renewed attention is Bitcoin’s Electrical Cost, an on-chain indicator that has quietly built a reputation for identifying major cycle bottoms.
The metric currently sits at approximately $48,694 and measures the average electricity expense miners incur to produce a single Bitcoin. Unlike traditional technical indicators that rely purely on price action, the Electrical Cost reflects the real-world energy required to secure the network. Because mining becomes economically challenging below this threshold, many analysts view it as a natural floor that Bitcoin rarely stays beneath for long.
Why Bitcoin’s Electrical Cost Matters
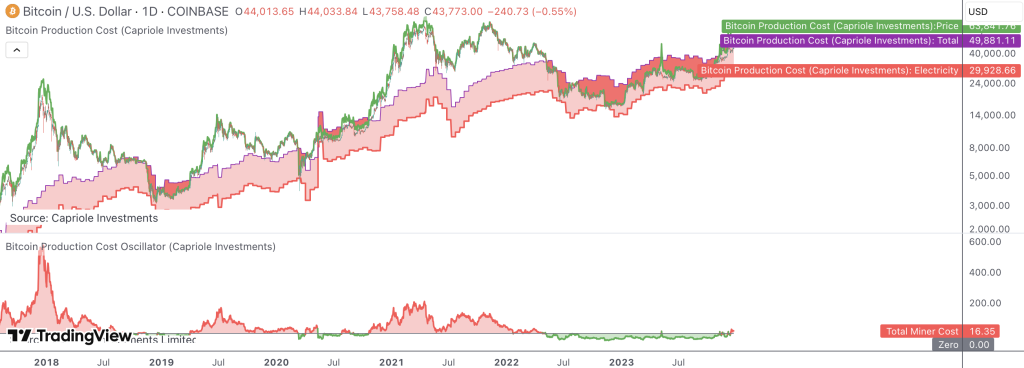
The Electrical Cost model was developed by Capriole Investments founder Charles Edwards and has become one of the more respected on-chain valuation tools in the market. It focuses strictly on energy expenses, distinguishing it from Bitcoin’s Production Cost, which includes additional factors such as mining hardware, infrastructure, and operating expenses.
Historically, the Electrical Cost line has served as a remarkably reliable support zone. Looking back across previous market cycles, Bitcoin found major bottoms near this level in 2015, 2018, 2020, and again during the brutal 2022 downturn. Each time, price either touched the metric or traded very close to it before eventually recovering. That’s why many investors see the current reading near $48,694 as more than just another data point.
Crypto analyst Ted Pillows recently highlighted this pattern, arguing that unless markets face an extreme external shock, Bitcoin is likely to find a floor somewhere around the $50,000 region. Edwards generally agreed with the observation but noted an important caveat. Bitcoin has dipped below the Electrical Cost line before, though only during short-lived periods of severe market stress.
A Key Piece of Bitcoin’s Support Structure
The Electrical Cost doesn’t exist in isolation. Instead, it forms part of a broader support ladder that analysts are monitoring closely as Bitcoin navigates its current correction.
The first major level sits near the 200-week moving average around $62,000, a zone Bitcoin recently tested for the first time during this cycle. Below that lies the realized price and 300-week moving average, both clustered near the $54,000 area. If those supports fail, attention would quickly shift toward the Electrical Cost at $48,694.
What makes this level particularly interesting is how it aligns with several independent cycle-bottom models. Multiple charting methods have identified the low-$50,000 to high-$40,000 range as a likely destination if Bitcoin experiences one final washout before a new bull market begins. Some analysts, including Benjamin Cowen, have also pointed to late 2026 as a probable timing window for a cycle bottom, creating an additional layer of confluence around the current projections.
What Could Push Bitcoin Below $48,694?
While the Electrical Cost has historically acted as a durable floor, it isn’t indestructible. Market history shows that extraordinary events can temporarily break even the strongest support levels.
The Covid crash in 2020 remains one example. During periods of panic, liquidity concerns often outweigh valuation models, causing assets to trade below what many consider fair value. Edwards himself has acknowledged that only a major economic shock, recession, or similar crisis would likely push Bitcoin meaningfully beneath its Electrical Cost for an extended period.
There is also precedent for long-term support levels failing. During the 2022 bear market, Bitcoin spent months below its 200-week moving average despite many investors believing that level would hold. If history repeats itself, the market could eventually test the $48,694 zone more directly.
All Eyes on Macro Conditions
The next stage of Bitcoin’s journey may depend less on crypto-specific developments and more on the broader macroeconomic environment. Investors are closely watching upcoming Federal Reserve decisions, interest rate policy, and global central bank actions for clues about risk appetite.
At the moment, Bitcoin sits in a somewhat uncomfortable middle ground. It remains above realized price and other key long-term supports, but well below levels that would signal a convincing recovery. A decisive breakdown under $54,000 could expose the Electrical Cost as the next major battleground between bulls and bears.
If that level holds, it would strengthen the argument that Bitcoin is approaching the final stages of its correction. If it fails, attention would quickly turn toward the $40,000 range, where several cycle-bottom models converge. Either way, the coming weeks could play a significant role in determining whether Bitcoin’s bear market is nearing its end or still has one more leg lower ahead.