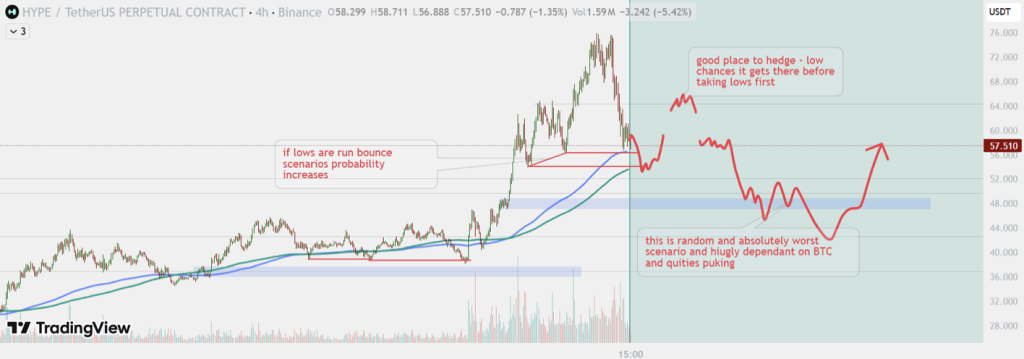
- HYPE has entered a corrective phase after a strong rally, currently trading around the $57-$59 range.
- A falling wedge pattern is developing, raising the possibility of a bullish reversal if resistance breaks.
- Key levels remain $56-$58 support and $65-$66 resistance, with traders waiting for confirmation of the next major move.
Hyperliquid’s native token, HYPE, has entered a noticeably different phase after months of strong upward momentum. Following a sharp retreat from recent highs, the asset is now hovering around the $57-$59 range, leaving traders divided over what comes next. Some see a healthy correction inside a larger bullish trend. Others believe the market may need more time before any meaningful recovery can begin.
The recent decline has been significant. At one point, HYPE lost more than 7% in a single intraday move, reinforcing the idea that the explosive rally seen earlier this year has cooled considerably. Analysts have begun describing the current environment as a “summer phase” — a period where enthusiasm fades, momentum slows, and markets spend time digesting previous gains before deciding on the next major direction.
Momentum Has Slowed, But the Bigger Trend Isn’t Broken Yet
Several market observers point to weakening price action as evidence that buyers are no longer in complete control. A recent TradingView analysis referred to as “HYPE summer” suggests the token has transitioned from a powerful expansion phase into a corrective structure. In simple terms, the easy upside may be over for now.
The market’s rejection from higher resistance zones has contributed to this shift. Each rally attempt has struggled to generate the same strength that characterized earlier advances. That’s often a warning sign that traders are becoming more cautious.
Still, it’s important to note that the broader trend remains relatively intact. While short-term momentum has weakened, the larger structure has not fully transitioned into a bearish market. Corrections after strong rallies are common, and many traders are waiting to see whether HYPE can establish a stable base before attempting another move higher.
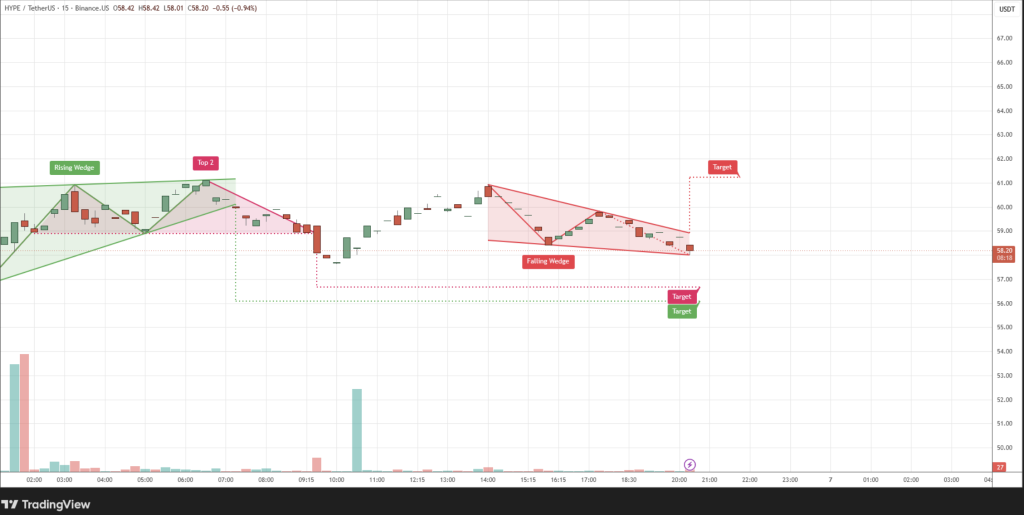
Falling Wedge Pattern Offers Hope for Bulls
One of the more interesting developments appearing on shorter timeframes is the formation of a falling wedge pattern. According to crypto analyst Crypto With Gopal, HYPE has been carving out a classic wedge structure on the 15-minute chart, characterized by converging trendlines and gradually weakening downside momentum.
For technical traders, this setup tends to attract attention because falling wedges are often associated with potential bullish reversals. They suggest that sellers may be losing conviction even as prices continue drifting lower.
Of course, patterns alone don’t guarantee anything. The market still needs confirmation.
For a true breakout signal to emerge, HYPE would likely need to break above the upper trendline while attracting stronger trading volume. Until that happens, the wedge remains a possibility rather than a certainty. Nevertheless, the pattern does hint that buyers are beginning to defend lower levels rather than abandoning the market entirely.
Key Price Levels Traders Are Monitoring
Several important zones are now shaping short-term sentiment around Hyperliquid.
Current trading activity remains concentrated between approximately $57 and $59. Just below that sits a crucial support area between $56 and $58. As long as buyers continue defending this region, hopes for a recovery remain alive.
On the upside, the first major hurdle sits around $65 to $66. This area has become one of the most closely watched resistance zones on the chart. A decisive break above it could significantly improve market sentiment and shift the conversation back toward bullish continuation.
Beyond that, traders are also watching a larger supply region between $72 and nearly $75, which previously acted as a strong rejection zone. Meanwhile, failure to hold current support could expose deeper downside targets around $53-$56, with some bearish scenarios extending toward the $45 area.
Indicators Show a Market Searching for Direction
Technical indicators currently paint a somewhat mixed picture.
Momentum oscillators such as RSI, MACD, Stochastic readings, and Williams %R are largely neutral. Rather than signaling a strong trend in either direction, they suggest the market is still trying to establish balance after recent volatility. This lack of conviction explains why price action has become choppier and less predictable.
Moving averages tell a slightly different story. Despite the recent decline, many longer-term moving average signals continue to lean bullish. That suggests the broader uptrend hasn’t completely broken down, even though short-term weakness remains visible.
When oscillators become neutral while moving averages remain constructive, it often reflects a transitional period. Markets pause, participants reassess risk, and eventually a new trend emerges. The challenge, of course, is determining which direction that trend will take.
Consolidation or Another Leg Lower?
Earlier this year, HYPE surged aggressively and briefly pushed into the $65-$75 region before encountering substantial selling pressure. Since then, the market has shifted into a consolidation phase marked by lower highs, increased volatility, and repeated failures to reclaim previous resistance levels.
This change in behavior has led many traders to adopt a more cautious approach. Instead of aggressively chasing upside, they’re waiting for confirmation before committing to larger positions.
For now, Hyperliquid sits at a technical crossroads. The falling wedge provides a potentially bullish narrative, while weakening momentum continues to support a more cautious outlook. If support around $56-$58 holds and buyers regain control above $65, confidence could return quickly.
Until then, patience may be the market’s most valuable asset. HYPE isn’t clearly bullish or bearish at the moment. It’s simply searching for its next direction, and traders know that periods like these often precede the market’s biggest moves.