
- Ethereum dropped more than 3% as Treasury yields surged to their highest level since 2025
- ETH futures open interest climbed to a record high despite ongoing market weakness
- Traders are closely watching key support levels as ETF outflows and bearish pressure continue
Ethereum moved sharply lower on Friday as broader risk markets weakened under growing macroeconomic pressure. The second-largest cryptocurrency by market cap dropped around 3.3% during the session, briefly falling to nearly $2,207 — its lowest level in over a month — before recovering slightly later in the day.
A major reason behind the decline appears tied to the sudden rise in US Treasury yields. The 10-year Treasury yield climbed toward 4.59%, reaching its highest level since May 2025. When yields rise this aggressively, risk assets like crypto often struggle because investors begin shifting capital toward safer government bonds that suddenly offer more attractive returns.
Higher yields also tend to tighten overall financial conditions. Borrowing costs increase, liquidity becomes more cautious, and speculative markets like crypto usually feel the pressure fairly quickly.
Ethereum Mirrors Weakness Across Tech Markets
Ethereum’s price action also tracked closely with weakness in traditional equities, especially tech-heavy indexes. The Nasdaq-100 fell roughly 1.23% during the same trading session, continuing a pattern where ETH behaves almost like a higher-volatility version of growth stocks during broader market selloffs.
That relationship has become increasingly noticeable over the last year. When tech sentiment weakens because of macro concerns, Ethereum often reacts even more aggressively due to its higher risk profile and leverage exposure across derivatives markets.
Still, beneath the surface, traders haven’t fully abandoned bullish positioning just yet.
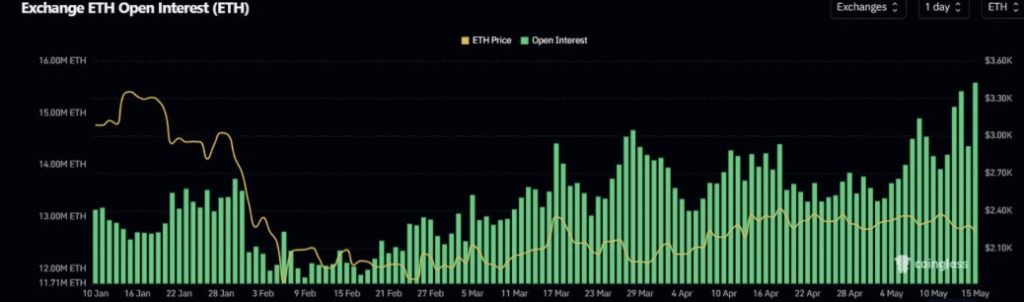
Futures Open Interest Hits Record High
Interestingly enough, Ethereum futures open interest actually surged to a record 15.6 million ETH despite the price decline. According to Coinglass data, this marked a new all-time high only two days after futures positioning had already broken previous records.
Open interest measures the total value of outstanding derivative contracts in the market. Rising open interest during falling prices can sometimes suggest traders are aggressively defending positions or adding leverage even as momentum weakens.
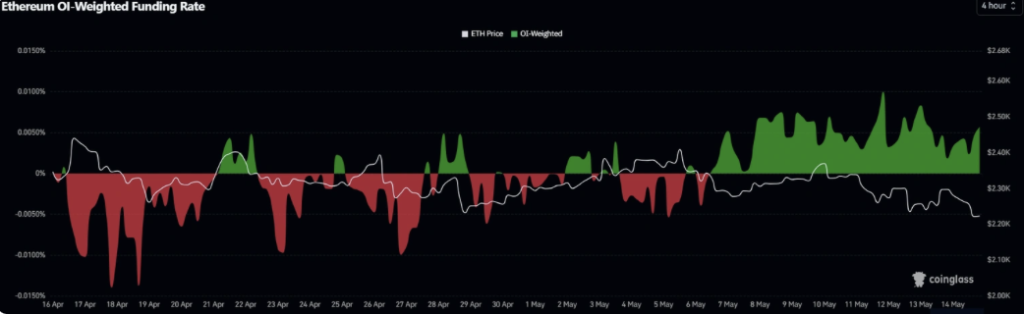
Funding rates have also remained positive for more than a week straight, marking the longest positive streak since January. Positive funding generally means long traders are still paying to maintain bullish positions, which shows many market participants continue expecting recovery despite recent weakness.
But there’s another side to that setup too. If ETH continues dropping while leveraged longs remain overcrowded, the market becomes increasingly vulnerable to a larger long squeeze event where forced liquidations accelerate downside pressure suddenly.
ETF Outflows and Technical Resistance Weigh on ETH
Institutional flows have also remained weak recently. US spot Ethereum ETFs recorded four consecutive days of net outflows this week, totaling approximately $189 million according to SoSoValue data. Persistent ETF outflows often reflect cooling institutional appetite, especially during periods of macro uncertainty.
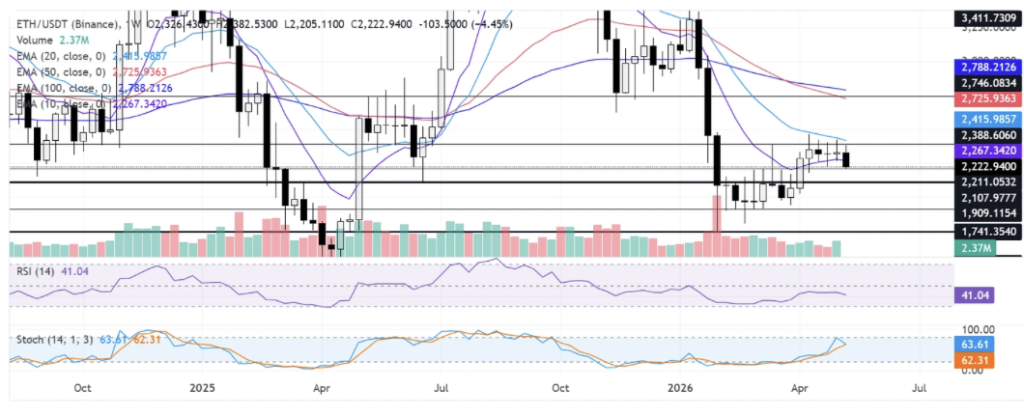
From a technical perspective, Ethereum’s structure still looks somewhat fragile. On the weekly chart, ETH remains trapped beneath both the 10-week and 20-week Exponential Moving Averages near $2,267 and $2,415. As long as price stays below those zones, broader bearish pressure technically remains intact.
Momentum indicators also show weakening conditions. The RSI currently sits around 41, suggesting buying interest remains relatively subdued, while the stochastic oscillator has started drifting lower after failing to maintain stronger bullish momentum.
If Ethereum loses support near $2,211, traders will likely begin watching lower downside zones around $2,108 and potentially even $1,909 if selling pressure intensifies further. On the upside, ETH first needs to reclaim resistance near the 10-week EMA before bulls can realistically begin targeting higher supply zones near $2,700 again.
For now, Ethereum appears caught between weakening macro conditions and stubborn bullish positioning inside derivatives markets — a combination that could create elevated volatility in the weeks ahead.