
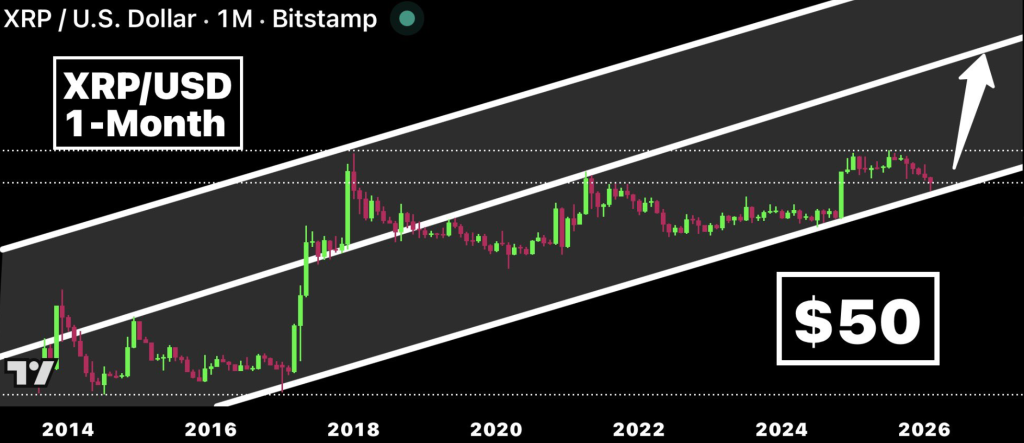
- CryptoBull’s long-term XRP chart shows a consistent ascending channel from 2014 to 2026.
- Repeated bounces from the lower boundary have historically triggered major rallies.
- If the channel structure holds, the upper boundary projects a potential target near $50.
Crypto analyst CryptoBull (@CryptoBull2020) recently shared a long-term XRP chart that, at first glance, looks almost too simple.
The chart stretches all the way from 2014 to 2026 and shows XRP moving inside a clearly defined ascending channel. No wild indicators. No complicated overlays. Just three lines. And according to CryptoBull, that’s enough to suggest XRP could eventually reach $50.
It sounds bold. But the structure itself is surprisingly clean.
Three Lines, One Long-Term Channel
The chart outlines three key boundaries: a lower support line, an upper resistance line, and a midpoint running between them.
The lower boundary has acted as long-term support for over a decade. Each time XRP drifted toward that line during market corrections, it didn’t just bounce — it snapped upward with force. That’s the kind of pattern that catches long-term traders’ attention.
The upper boundary, on the other hand, has capped major rallies. It represents the long-term resistance zone where euphoric cycles have historically cooled off. The middle line functions almost like equilibrium — a gravity point where price tends to hover during consolidation phases.
CryptoBull summed it up bluntly: “All we need are 3 lines to tell us that XRP will hit $50.”
Simple, maybe. But the consistency of the channel is hard to ignore.
A Decade of Structure
Looking back, XRP spent the 2014–2016 stretch mostly in accumulation. Price action was slow, almost boring. Then came the explosive breakout into 2017 and early 2018, where XRP surged dramatically toward the upper boundary.
After that rally faded, XRP didn’t collapse out of the channel. It drifted toward the midpoint and consolidated there for years. That long grind shaped the 2020–2024 structure, which eventually led to another major move — including the roughly 500% surge in late 2024 that pushed price back toward the channel’s middle region.
The pattern repeats more often than coincidence would suggest. When XRP approaches the lower boundary, buyers historically step in. Not instantly, not perfectly, but consistently enough to form a recognizable rhythm.
It’s almost mechanical. Test support. Accumulate. Expand.
Why $50 Isn’t Just a Random Number
According to the chart, if XRP continues respecting this ascending channel, the logical long-term destination would be the upper boundary — which now sits around $50 by 2026.
That projection isn’t based on hype or sudden catalysts. It’s based on structural continuation. If the slope of the channel holds and XRP remains above the lower trendline, the path naturally angles upward over time.
Of course, that doesn’t mean XRP teleports there overnight. These channel expansions play out over years. There would be volatility, shakeouts, and likely multiple mid-cycle corrections along the way.
But structurally? The framework points upward.
Simplicity Over Complexity
What makes this analysis stand out is its minimalism.
CryptoBull isn’t leaning on oscillators, macro forecasts, or speculative narratives. The argument is simply that XRP has respected its channel for over a decade. If that continues, the trajectory remains intact.
In a market that often overcomplicates things, there’s something almost refreshing about that approach.
Whether XRP actually reaches $50 depends on whether the channel holds. But if history is any guide, those three lines have quietly shaped XRP’s journey for years — and they may not be done yet.