

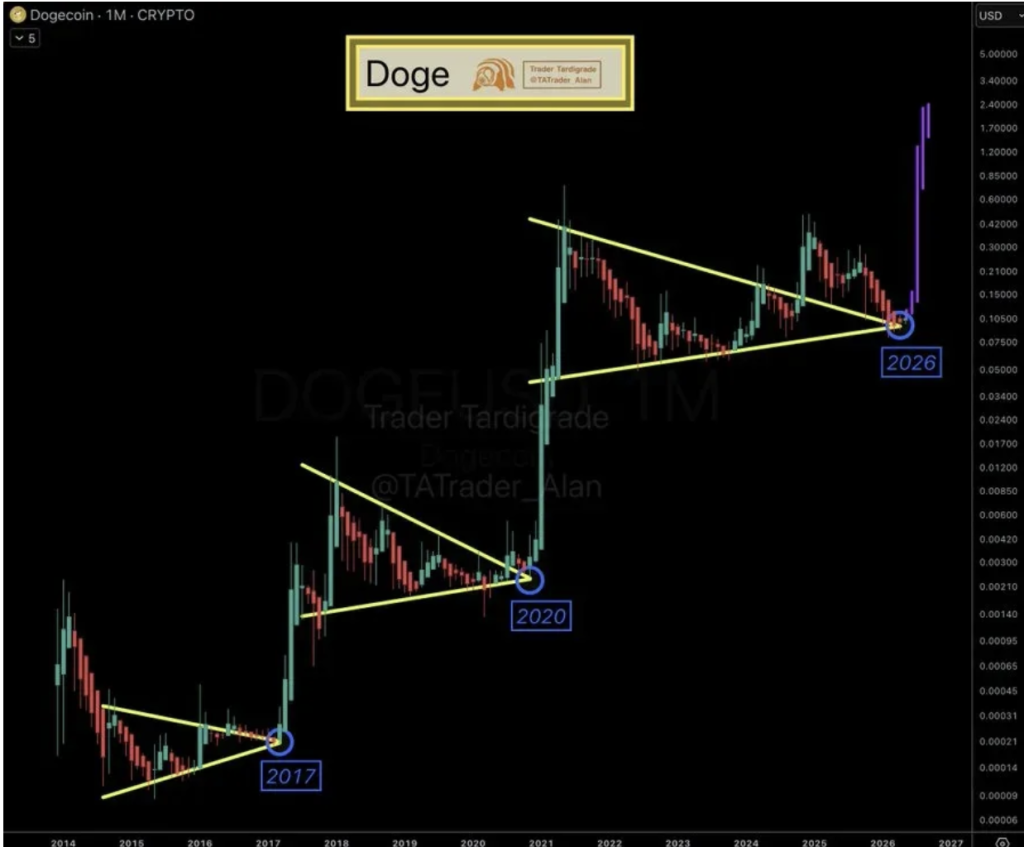
- Analysts have identified a Dogecoin triangle pattern similar to structures seen before the 2017 and 2020 rallies.
- DOGE remains inside a long-term compression setup as traders watch for a possible breakout attempt.
- Analysts caution that historical chart similarities do not guarantee another major rally.
Dogecoin is back in the spotlight after several crypto analysts noticed a familiar chart structure forming on the monthly timeframe, one that closely resembles patterns seen before DOGE’s explosive rallies in previous market cycles.
The setup has already triggered fresh discussions across trading communities, especially among technical analysts who remember the huge price surges that followed similar consolidation phases in both 2017 and 2020. While nobody can guarantee history repeats exactly the same way, traders are still paying close attention because the similarities are hard to ignore.
According to analysts sharing charts online, Dogecoin currently appears to be forming another long-term triangle compression structure. In past cycles, DOGE spent extended periods trading sideways inside narrowing ranges before eventually breaking upward with strong momentum. That same kind of compression now seems visible again on the higher timeframe charts.
What makes these setups interesting is the way support and resistance gradually tighten over time. Price volatility starts shrinking, trading ranges narrow, and eventually the market reaches a point where pressure builds enough to force a larger directional move. In earlier cycles, Dogecoin remained stuck inside these structures for months before volatility suddenly returned in dramatic fashion.
Analysts Point to Familiar Compression Pattern
Several traders noted that the current DOGE structure visually mirrors the same triangle formations that developed before earlier breakouts. Those previous patterns eventually led to some of the most aggressive rallies in meme coin history, helping turn Dogecoin from an internet joke into a globally recognized crypto asset.
Back during the 2017 and 2020 cycles, DOGE experienced long stretches of consolidation where price moved sideways without much excitement. Then momentum arrived almost unexpectedly, triggering explosive rallies fueled by retail enthusiasm, social media hype, and broader crypto market strength.
Now, analysts believe the current structure may once again be approaching the upper end of its compression range. That doesn’t automatically mean a breakout is guaranteed of course, but it does place extra attention on upcoming price action as the pattern tightens further.
Triangle compression patterns are commonly used in technical analysis because they often signal periods where volatility is drying up before a larger move begins. Traders usually interpret these formations as signs the market is building energy underneath the surface, though predicting the eventual breakout direction can still be difficult.
In Dogecoin’s case, many observers remain focused on whether price can eventually break through descending resistance levels that have capped rallies during the latest consolidation period.
Historical DOGE Rallies Still Influence Market Sentiment
The memory of Dogecoin’s past rallies continues shaping market expectations even years later. During both the 2017 and 2020 runs, DOGE delivered enormous percentage gains that caught much of the market off guard. Retail participation exploded during those periods, and social media activity around the token surged almost nonstop.
Some analysts believe these recurring patterns may partly reflect investor psychology repeating itself across different market cycles. Speculative assets often attract similar crowd behavior during periods of optimism, especially when retail traders begin searching for higher-risk, high-reward opportunities.
At the same time though, today’s crypto market looks very different compared with earlier DOGE cycles. Institutional participation is far larger now, macroeconomic conditions carry more influence, and overall liquidity conditions have changed significantly across digital assets.
That means even if technical patterns appear similar on the surface, outside variables could still alter the eventual outcome. Markets evolve, and traders know relying entirely on historical analogies can sometimes become dangerous.
Analysts Warn That Patterns Alone Do Not Guarantee Breakouts
Despite the growing excitement surrounding the chart structure, analysts continue urging caution. Technical similarities alone don’t guarantee Dogecoin will repeat its previous parabolic moves, especially in a market environment where sentiment can shift extremely fast.
Many traders are also monitoring Bitcoin and the broader crypto market closely because DOGE historically tends to move alongside overall market momentum during major rallies and corrections. If broader crypto conditions weaken, even bullish chart setups can fail to deliver sustained breakouts.
Liquidity, macroeconomic developments, market sentiment, and risk appetite all continue playing major roles in determining whether any breakout attempt actually holds. Right now, the triangle formation mainly tells traders that Dogecoin may be approaching an important decision point rather than confirming a guaranteed rally.
Still, the pattern’s reappearance has definitely captured attention. Whether this becomes another historic DOGE breakout or simply another extended consolidation phase will likely depend on much more than the chart alone.