
- DOGE is testing long-term support near $0.10, a level some call a historical bottom channel.
- Short-term charts suggest a possible bounce toward $0.104–$0.11 to sweep short liquidations.
- Broader bearish structure and weak demand mean any rally could remain temporary.
Dogecoin is hovering at a level that long-term traders tend to stare at a little too closely.
Right around the $0.10 zone, some analysts are calling it a “historical bottom channel.” In simple terms, that area has acted as major support before, and now DOGE is back there again. Whether that truly marks a long-term market bottom is still up for debate, but it’s not a random level — that much is clear.
The broader backdrop doesn’t help. The memecoin sector has been bleeding for months, and overall crypto sentiment still feels heavy. Some market watchers are even projecting a prolonged bear phase stretching into Q4 2026, maybe longer. That kind of outlook makes every bounce feel suspicious.
Short-Term Bounce, Long-Term Uncertainty
Even if the ultimate bottom isn’t in, a short-term bounce seems plausible.
Markets rarely move in straight lines. When liquidity builds up overhead — especially clusters of short positions — price often pushes up just far enough to trigger liquidations before rolling back over. That’s the uncomfortable part about trading in a downtrend.
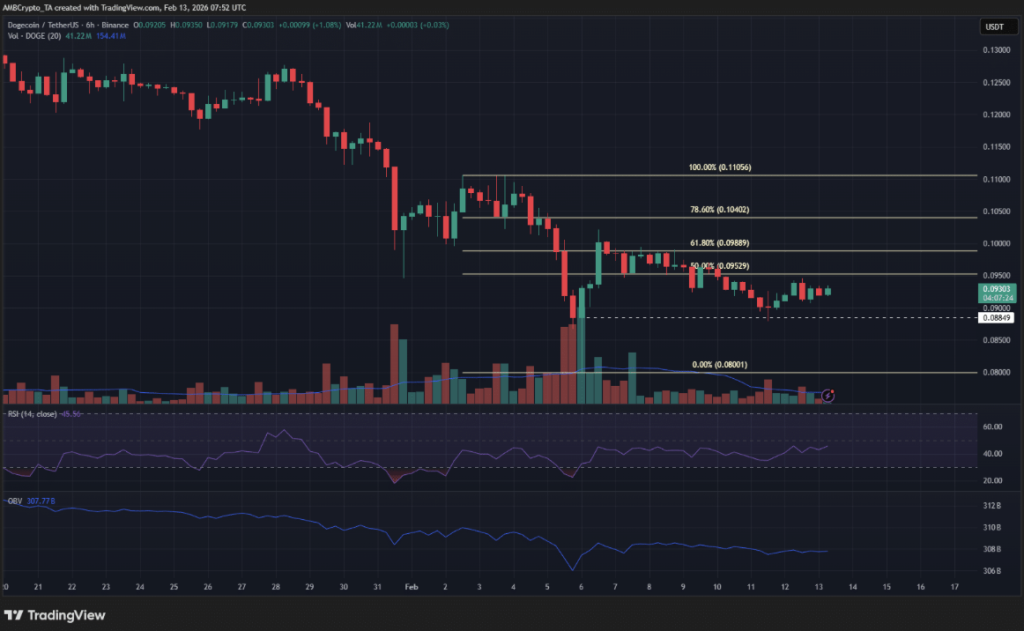
On the 6-hour chart, DOGE is clearly in a bearish structure. A recent bounce toward $0.10 quickly faded, dragging price back to around $0.0885. That drop effectively retested the session close from the February 6 crash, which is technically meaningful.
There’s a decent argument that Dogecoin could drift higher again to sweep liquidity above $0.10 before continuing lower. But calling for a full recovery? That’s harder to justify. The longer-term structure remains weak, and on-balance volume (OBV) hasn’t shown convincing demand returning to the market.
Fibonacci retracement levels from the latest H6 swing highlight $0.0989 and $0.1040 as key resistance levels. If a bounce unfolds, $0.1040 looks like the magnet.
The 1-Hour Chart Tells a Subtle Story
Zooming in, the 1-hour chart gives a bit more nuance.
The internal structure hasn’t fully flipped bullish, which matters. However, price action is starting to stabilize. The $0.094 level remains a short-term resistance, but momentum suggests it could be cleared soon.
The hourly RSI has climbed back above the neutral 50 line, which signals short-term strength returning. More importantly, the defense of the $0.0885 support and the formation of a higher low near $0.091 over the past 24 hours hint that buyers are at least trying.
Still, this looks more like a tactical bounce setup than the beginning of a major trend reversal.
Liquidity Map Suggests a Short Squeeze Setup
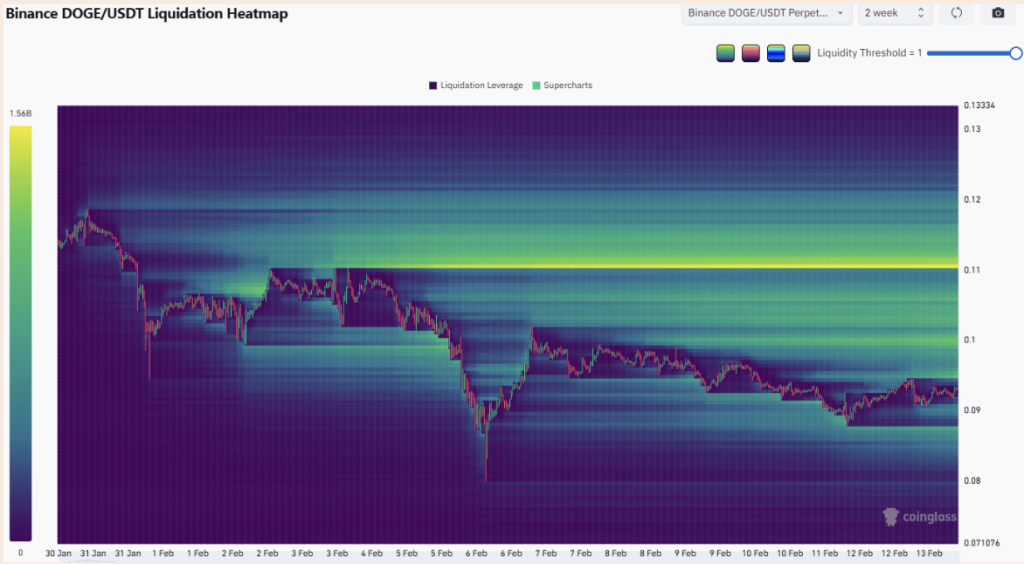
The liquidation heatmap adds another layer.
Over the past two months, there’s been a noticeable cluster of short liquidations building above $0.10, particularly near $0.11 — the level where local highs formed in early February. Markets are drawn to liquidity like magnets. If enough shorts are stacked there, price could spike upward to trigger them.
That doesn’t mean it has to happen. But it’s a realistic scenario.
Right now, though, the risk-reward profile isn’t especially attractive in either direction. Going long before confirmation carries downside risk. Going short before the potential squeeze plays out could be painful.
And there’s the Bitcoin factor. If BTC breaks below $62K and accelerates downward, DOGE likely won’t hold $0.10 for long. In that case, new lows become far more probable, and the short-squeeze scenario fades quickly.
So yes, Dogecoin might bounce. It might even pop above $0.10 briefly. But the broader trend is still fragile, and until structure shifts meaningfully, any rally should probably be treated as tactical — not transformational.