- LINK is up 5% on the week after defending $7.52 and rebounding toward $8.39–$8.42.
- Chainlink reserves and revenue surged, suggesting fundamentals are strengthening beneath price action.
- Liquidity is clustered at $9–$9.3, which could pull LINK higher if momentum continues.
Chainlink is starting to show signs of life again, and not just the “random green candle” kind either.
Over the past week, LINK is up around 5% after holding support near $7.52. Instead of breaking down and sliding into a deeper leg lower, the token bounced back toward the $8.39–$8.42 area. That move doesn’t magically flip the entire trend bullish, but it does shift short-term momentum in a more constructive direction. Cautiously, at least.
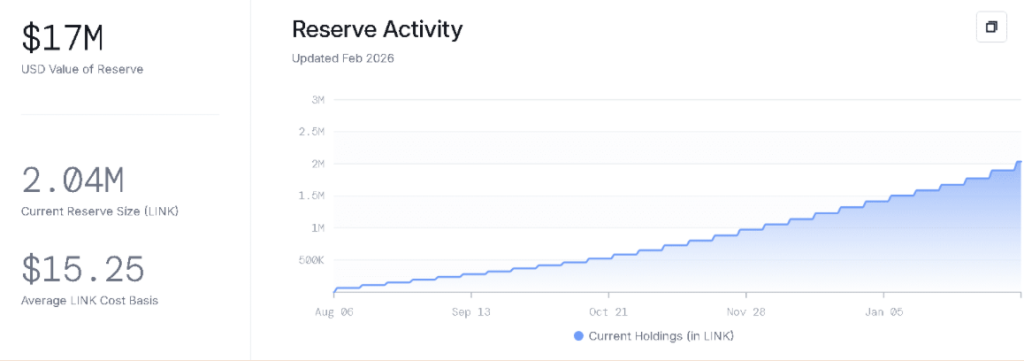
What’s more interesting is what’s happening under the surface. Chainlink’s reserve reportedly climbed to around 2 million LINK, worth roughly $17 million, and revenue jumped sevenfold. That’s not a small bump. It suggests something is accelerating operationally, even while price action still looks compressed.
LINK Fundamentals Are Quietly Improving
This recent reserve and revenue growth doesn’t look like a cosmetic metric spike. It points to actual protocol activity picking up.
Chainlink tends to move in cycles where fundamentals improve first, then price catches up later (sometimes painfully later). When reserves increase and revenue expands, it’s usually a sign that the ecosystem is doing more business behind the scenes, not less.
That doesn’t guarantee a breakout. But it does change the tone. It’s harder to call LINK “dead money” when the fundamentals are literally heating up.
LINK ETFs Are Seeing Consistent Institutional Inflows
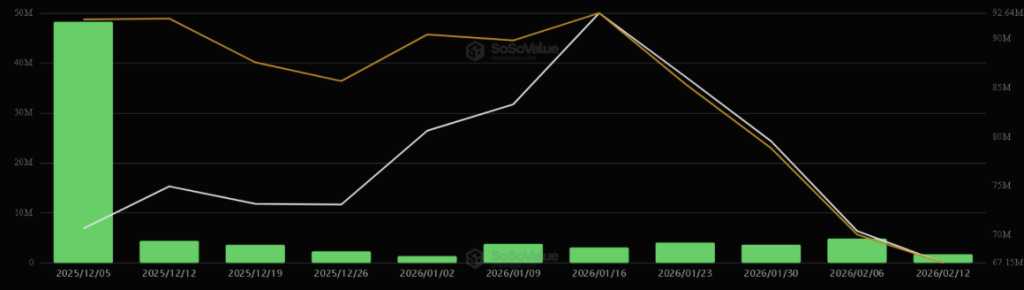
One of the strongest data points in the update is the ETF flow picture.
LINK ETFs have reportedly recorded inflows every single week since launch. This week alone added around 1.71 million LINK, and there have been no recorded outflows so far. That’s the kind of steady accumulation pattern that tends to matter over time, even if the price doesn’t react immediately.
It also shows institutions aren’t trading this like a meme coin. They’re not jumping in and out. They’re building exposure slowly, almost boringly, which is usually the most bullish kind of buying.
Meanwhile, retail participation still looks hesitant near resistance. The price is moving, but it’s not euphoric. That disconnect often happens when “smart money” accumulates while the broader market is still cautious.
LINK Defended $7.52 and Rebounded Into Resistance
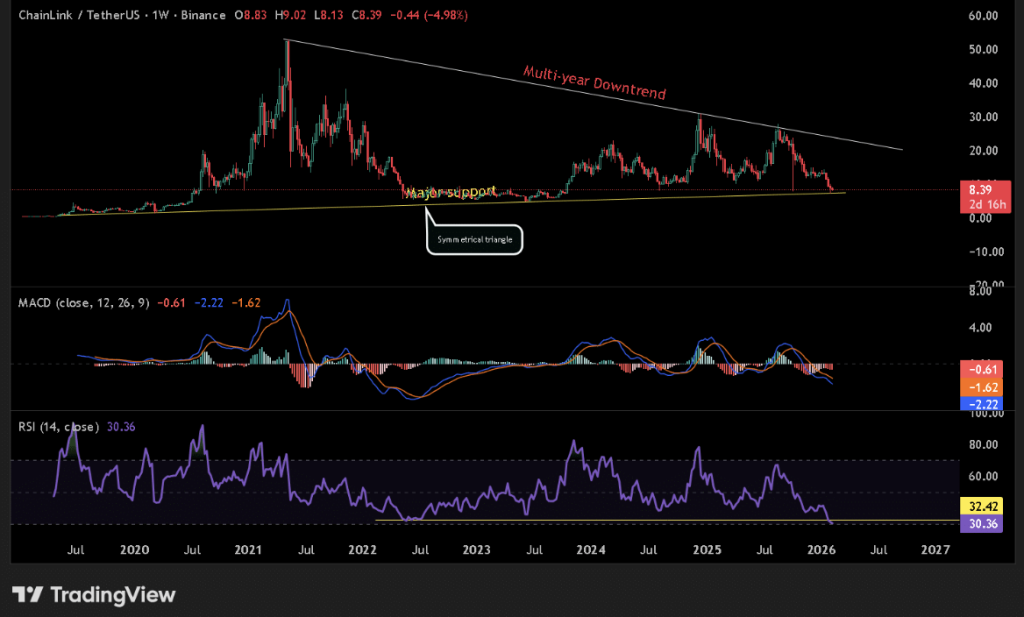
Technically, the $7.52 level was a big deal.
LINK tapped the lower boundary of a symmetrical triangle and held it. Instead of a breakdown, it rebounded hard toward the $8.39–$8.42 range. That kind of reaction suggests buyers stepped in with intent, not fear. It wasn’t a weak bounce. It was a “nope, not today” bounce.
Even more notable: the RSI reportedly dropped below 32 for the first time ever. That’s a pretty extreme reading, and it usually signals exhaustion rather than fresh panic. In that zone, sellers often start running out of fuel, and dip buyers start sniffing around.
Still, reclaiming higher levels remains unfinished business. LINK has bounced, yes, but it hasn’t proven it can sustain momentum. If follow-through doesn’t show up, the market could easily sweep liquidity again and drag price back down for another test.
So the structure held, but conviction still needs confirmation.
Bullish Flag Forming as Momentum Builds
On the lower timeframes, LINK has been forming what looks like a bullish flag, a pattern that has also shown up across several major caps recently.
Historically, flags can lead to sharp upside expansions once price breaks out. That’s why traders are watching this setup closely. It’s the kind of pattern that can go from “quiet” to “violent” in a hurry.
On the 4-hour chart, LINK is hovering around the breakout zone. The MACD histogram has flipped positive, which supports the idea that bullish momentum is strengthening. Bulls aren’t just defending support anymore. They’re starting to push.
Not aggressively, but noticeably.
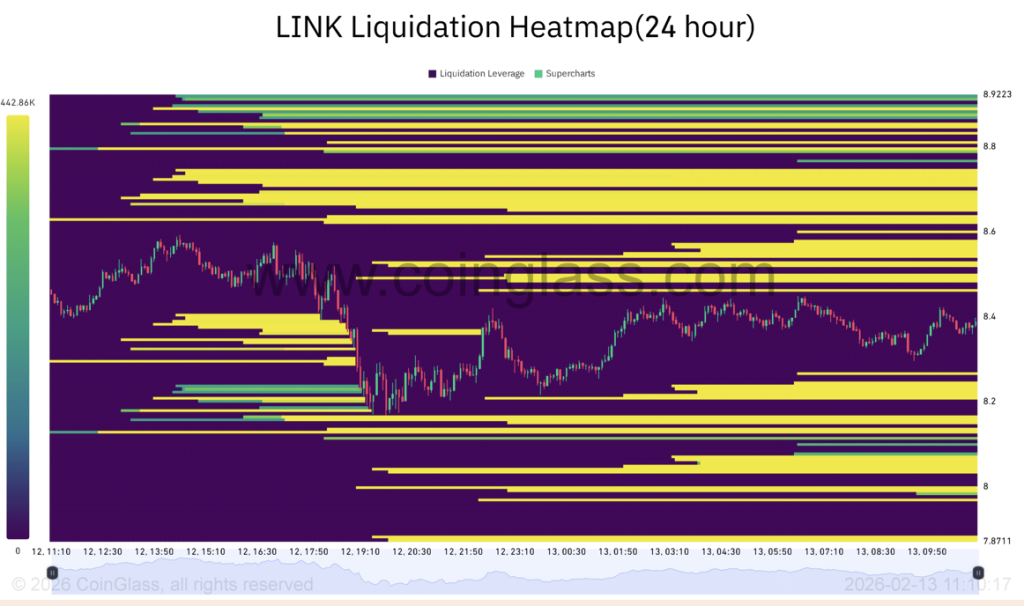
Liquidity at $9–$9.3 Could Act Like a Magnet
CoinGlass liquidity data shows a heavy cluster sitting between $9 and $9.3. That zone is basically a magnet. If LINK starts pushing upward with enough strength, price could accelerate quickly as it hunts that liquidity pocket.
At the same time, there’s still liquidity sitting below, around the $7.8 to $8 area. So in typical market fashion, price is likely to hunt one side first, hard, before making a more directional move.
That’s the current setup. LINK is sitting in a decision zone, with strong fundamental tailwinds building underneath and a technical structure that’s starting to tilt bullish.
The market just hasn’t picked its direction yet. But it’s getting close.