
- Bitcoin exchange outflows have turned negative again, signaling reduced selling pressure.
- Funding rates and leverage have cooled considerably, creating a healthier market structure.
- Analysts say stronger spot demand is still needed before a full bullish recovery can be confirmed.
Bitcoin’s recent correction was accompanied by a noticeable surge in exchange inflows, a development that often raises concerns about increased selling activity. However, that trend is beginning to shift. Fresh on-chain data suggests that traders may be moving away from distribution and toward a more stable market environment, even if a complete recovery remains a work in progress.
While Bitcoin continues to trade well below its recent highs, several underlying indicators are showing signs of improvement. Exchange balances are falling, leverage has cooled, and derivatives positioning appears much less aggressive than it was during previous market swings. Taken together, these changes suggest that the worst of the recent selling pressure may be fading.
Exchange Outflows Point to Reduced Selling Activity
One of the more encouraging developments comes from Bitcoin’s Exchange Netflow data. At the time of reporting, netflow had returned to negative territory, dropping to approximately -303.67 BTC. The seven-day cumulative reading was also negative, sitting near -1,232 BTC.
Negative netflow generally indicates that more Bitcoin is leaving exchanges than entering them. In simple terms, investors appear less interested in keeping coins on trading platforms where they can be sold quickly. Instead, assets moving off exchanges are often interpreted as a sign of longer-term holding behavior.
This doesn’t automatically guarantee higher prices, of course. But when exchange outflows increase while selling activity declines, it can create a more favorable backdrop for future price stability.
Derivatives Market Becomes Less Aggressive
The derivatives market is showing a similar cooling trend. Funding rates, which measure the cost of holding leveraged positions, fell sharply from 0.003985 to just 0.000337.
That decline suggests many long positions have been reduced or closed. Excessive leverage often amplifies volatility, so a reduction in speculative positioning is generally viewed as a healthy reset for the market.
At the same time, Bitcoin’s Open Interest rose only slightly to around $21.24 billion. The relatively modest increase indicates traders are not aggressively piling into leveraged bets despite recent price stabilization. That’s an important distinction. Previous rallies were often fueled by excessive leverage, which sometimes led to painful liquidations when momentum reversed.
For now, the derivatives market appears considerably more balanced than it did just weeks ago.
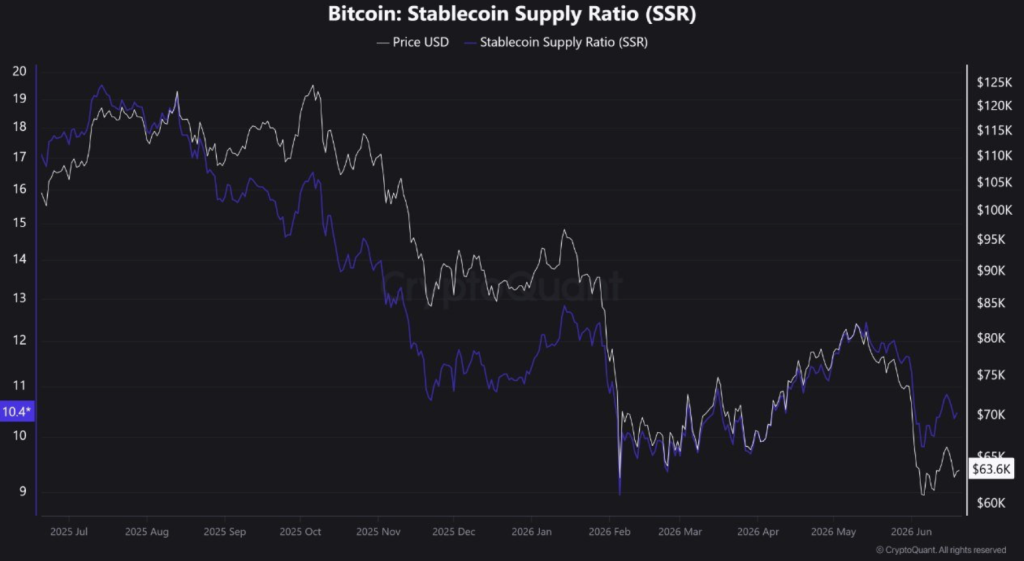
Stablecoin Liquidity Remains Available
Another notable metric is Bitcoin’s Stablecoin Supply Ratio (SSR), which currently sits around 10.46. Compared to earlier stages of the market cycle, this reading remains relatively low.
A lower SSR suggests there is still a meaningful amount of stablecoin liquidity available on the sidelines. In other words, capital exists that could potentially flow back into Bitcoin if investor confidence improves.
When declining exchange balances are paired with available stablecoin liquidity, market participants often view it as a constructive combination. Selling pressure is easing, while buying power remains present. The missing ingredient, at least for now, is stronger demand capable of turning that liquidity into sustained market participation.
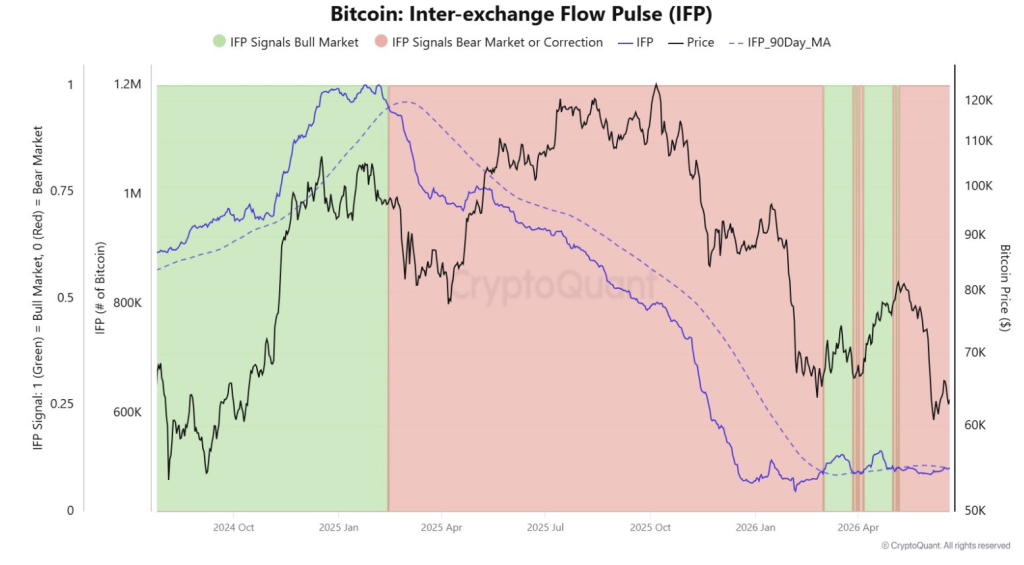
Inter-Exchange Flow Pulse Signals Improving Conditions
Beyond exchange balances and derivatives activity, the Inter-exchange Flow Pulse (IFP) is also beginning to attract attention. Throughout much of 2025 and early 2026, the indicator remained below its 90-day moving average as Bitcoin declined from above $120,000 toward the $60,000 region.
During that period, bearish signals dominated market sentiment. However, recent weeks have shown a noticeable shift. The IFP has started stabilizing and gradually moving closer to its longer-term averages.
Historically, these transitions have often coincided with stronger accumulation phases and healthier market conditions. Previous bullish crossovers in the indicator were frequently followed by significant price advances, although there is never a guarantee that history will repeat itself exactly.
The encouraging part is that the trend appears to be improving rather than deteriorating.
Bitcoin Still Needs Stronger Demand
Despite the progress across several key metrics, analysts remain cautious about declaring a full trend reversal. The data points to declining sell-side pressure, but that alone is not enough to fuel a major rally.
Spot demand remains the critical piece of the puzzle. Until new buyers enter the market in meaningful numbers, Bitcoin may continue to trade within a broader consolidation phase. Reduced selling pressure creates the opportunity for recovery, but actual demand is what ultimately drives sustained price appreciation.
For now, Bitcoin appears to be transitioning from a period of distribution into one of stabilization. Exchange outflows are improving, leverage has cooled, and the IFP is showing early signs of recovery. Whether those developments translate into a larger bullish trend will likely depend on whether spot market demand begins to strengthen in the weeks ahead.