
- SUI has dropped to around $0.90, down nearly 83% from its all-time high, with only 8 green days in the past month.
- Technical indicators show oversold conditions, but trend strength remains firmly bearish with strong downward momentum.
- A break below $0.86 could open the door to $0.79, while bulls must reclaim $1.00–$1.10 to shift sentiment.
SUI is under heavy pressure. The Layer-1 token has fallen to around $0.90, its weakest level since September 2024, and is currently hovering near $0.94. That places it roughly 83% below its all-time high of $5.35. It’s been a sharp, grinding decline. Not dramatic in a single candle, but relentless.
The past month tells the story. Only eight green days in 30 sessions. February alone delivered a 47% drop, while volatility surged close to 22%. Every bounce attempt has met sellers waiting overhead. The trend hasn’t just been negative. It’s been structurally controlled by bears.
Oversold Doesn’t Mean Reversal
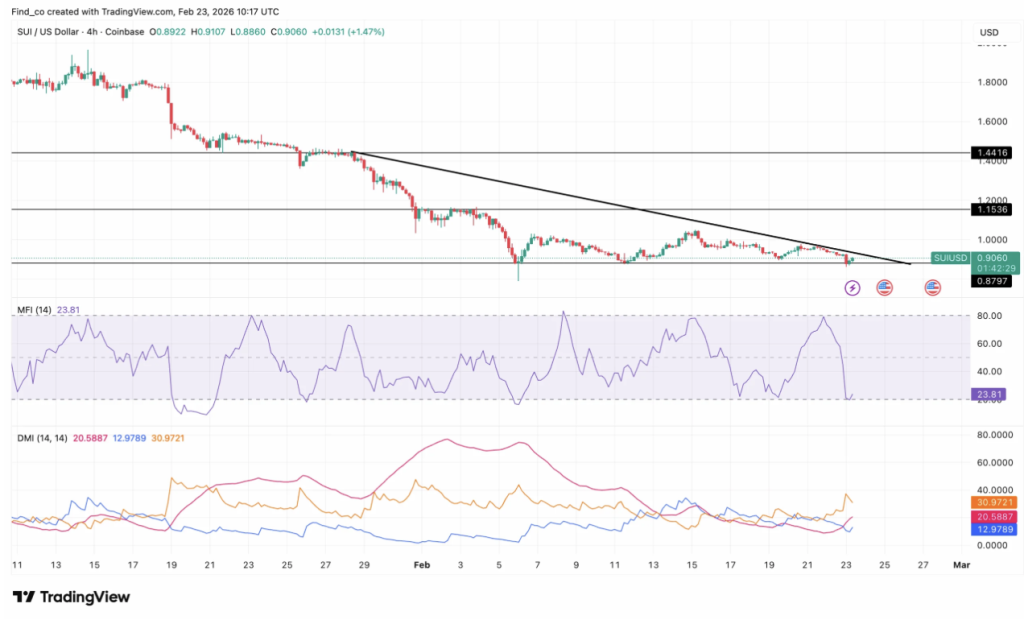
On the 4-hour chart, SUI remains locked in a clear lower-high structure that has been intact since mid-January. Price is compressed between roughly $1.15 on the upside and $0.82 below. Each rally fades before it can break resistance.
The Money Flow Index has fallen to around 19.6, technically oversold territory. Normally, that kind of reading can spark relief bounces. But oversold conditions don’t guarantee reversals. Sometimes they simply reflect strong selling pressure. And right now, that seems to be the case.
The Directional Movement Index reinforces this view. The negative DI line sits well above the positive DI, while the Average Directional Index holds above 30. That combination signals a strong active trend. Unfortunately for bulls, it’s pointing down.
In simple terms, downward momentum isn’t just present. It’s dominant.
Nasdaq Debut Fails to Shift Sentiment
Interestingly, SUI recently debuted on Nasdaq through the SUIS ETF on February 18, providing regulated public exposure to the asset. On paper, that’s a significant milestone. Institutional access. Traditional finance integration. The kind of development that often sparks enthusiasm.
But price didn’t respond.
Despite the listing, SUI has struggled to attract meaningful follow-through buying. The ETF could open the door to long-term capital flows, especially as the network expands across stablecoins and global payment use cases. Still, in the short term, macro weakness and technical pressure appear stronger than headline optimism.
Daily Chart Shows Bears in Control
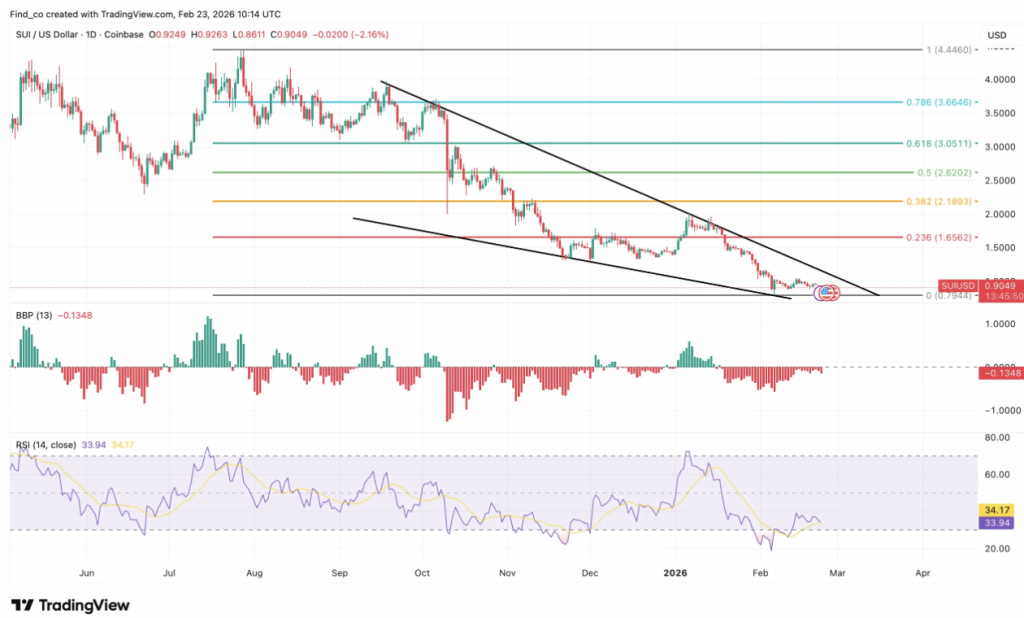
On the daily timeframe, SUI remains trapped inside a descending channel. Each bounce fades before reaching the mid-channel resistance line. Previous Fibonacci levels around 0.236 and 0.382 failed to hold as support, reinforcing seller control.
The lower channel boundary now aligns with horizontal support near $0.86. If that breaks decisively, the next area of interest sits around $0.79, near the zero Fibonacci level.
Momentum indicators offer little comfort. The Bull Bear Power remains negative, and the Relative Strength Index hovers around 33. That signals weakness, though not extreme exhaustion.
For bulls to regain credibility, SUI would need to reclaim at least the $1 psychological level, and ideally break above $1.10 to challenge the descending structure. Until then, upside moves appear corrective rather than transformative.
Right now, rallies are sold into. Momentum favors the downside. And unless something shifts materially — sentiment, liquidity, or structure — the path of least resistance remains lower.