
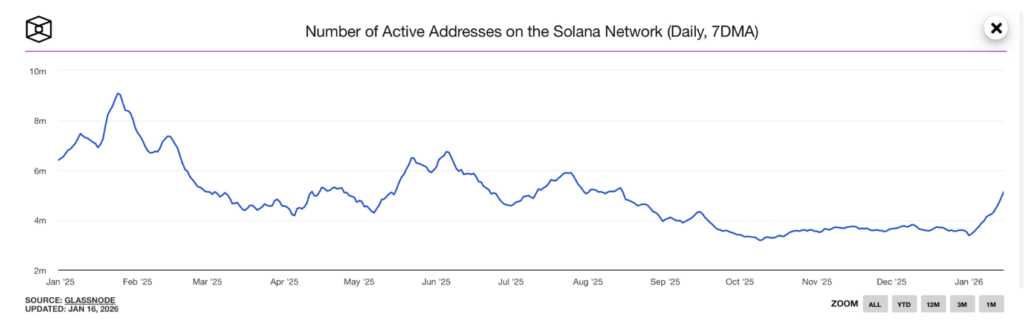
- Solana’s active addresses are rebounding after a long period of decline
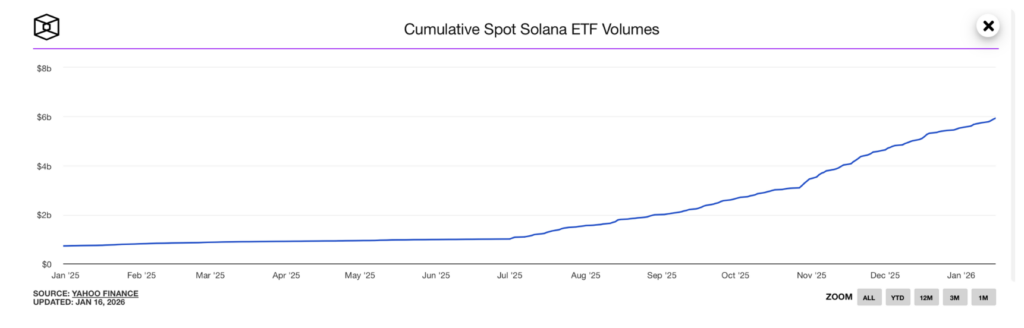
- Spot ETF volumes near $6 billion signal steady institutional participation
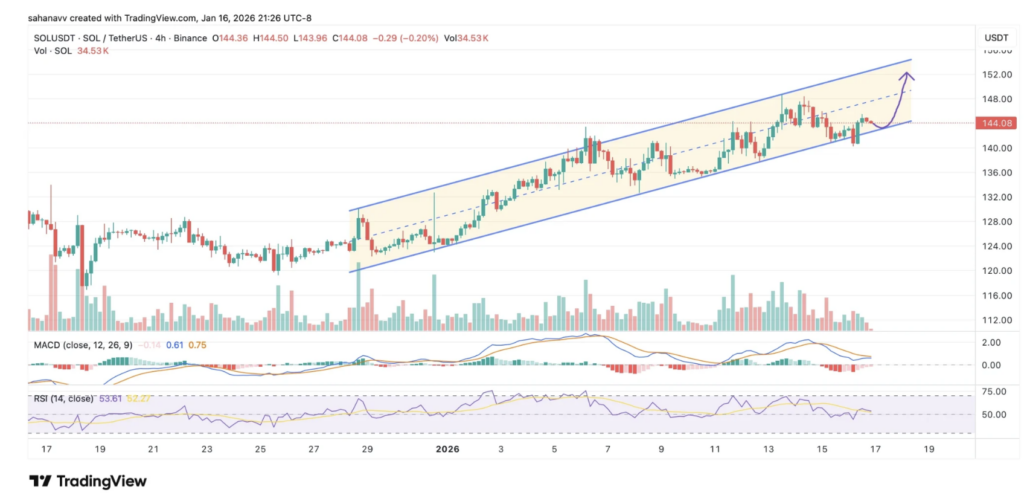
- A breakout above $152 could unlock higher targets, while $140 remains key support
Solana’s price is starting to show early signs of a reset after months of cooling activity across the network. New on-chain data suggests active addresses are ticking higher again, hinting that participation may be returning after a long, quiet second half of last year. At the same time, spot Solana ETF volumes have continued to grind higher toward the $6 billion mark, pointing to growing institutional interest, even without the noise of a retail-driven rush.
Solana’s Network Activity Is Slowly Waking Up
Throughout much of 2025, Solana’s active address count trended lower, reflecting a steady drop in on-chain engagement. That trend appears to be shifting as 2026 gets underway. After remaining mostly flat in Q4, active addresses have rebounded meaningfully, suggesting traders and users are paying attention again.
Data shows a move from roughly 3.4 million active addresses to above 5 million, which is not a trivial bounce. It signals that demand is resurfacing directly on the network, not just through exchange trading. That said, this is still an early signal. It points to potential recovery, not a full-blown reacceleration just yet.
ETF Volumes Suggest Quiet Institutional Demand
Solana’s spot ETF, which launched in late October 2025, has seen consistent inflows since going live. Cumulative trading volumes have steadily climbed and are now approaching $6 billion. Rather than sharp spikes, the data shows repeated, measured engagement, a pattern often associated with institutional positioning.
ETFs provide a clean access point for investors who prefer not to interact with exchanges directly. Rising volumes here suggest sustained interest, not one-off speculation. This steady demand supports the idea that SOL is being accumulated quietly, which could matter if price action starts to confirm the move higher.
SOL Price Structure Remains Constructive
While Solana’s longer-term chart may look uneventful at first glance, the shorter-term structure tells a different story. On the four-hour chart, SOL continues to trade within a rising parallel channel, keeping the broader bullish trend intact. After briefly slipping below the channel, price reclaimed it quickly, a move that often signals strength rather than exhaustion.
Momentum indicators are mixed, but not alarming. RSI is hovering near neutral while staying within the upper range, and the MACD is flattening as selling pressure fades. This combination usually points to consolidation within an uptrend, not a clear reversal. Price is tightening, which often precedes a larger directional move.
Key Levels That Could Decide the Next Move
The immediate resistance zone sits between $150 and $152. Below that, the $143 to $144 range could act as a short-term barrier if momentum stalls. A decisive break above $152, backed by stronger volume, would likely open the door toward higher targets, potentially near $170.
On the downside, a rejection that pushes SOL below $140 would weaken the channel structure and increase the odds of a deeper pullback. Even then, a move toward $138 or $140 wouldn’t necessarily break the broader trend, but it would delay any upside continuation.
The Bigger Picture
Solana isn’t setting up for a hype-driven surge, at least not yet. Instead, the picture looks more measured. Active addresses are recovering, ETF flows point to steady institutional involvement, and price is holding a rising structure while momentum cools in neutral territory.
The trigger is straightforward. SOL needs a clean break and hold above the $150–$152 zone, with volume, to confirm the next leg higher. Until that happens, this remains a patient bullish setup, where short-term pullbacks are still very much part of the process.