
- LINK has formed its first higher low since the bear market, signaling a possible structural shift
- Strong support has emerged around $13.50–$13.70 as buyers step in earlier
- A breakout above $15.00 and $16.50 is needed to confirm a full trend reversal
For most of this cycle, Chainlink’s price has followed a pattern that traders know a little too well. LINK rallies, runs into resistance, then slowly bleeds lower. Rinse, repeat. That rhythm has played out again and again on the LINK/BTC chart, which is why a recent observation from Michaël van de Poppe is getting extra attention.
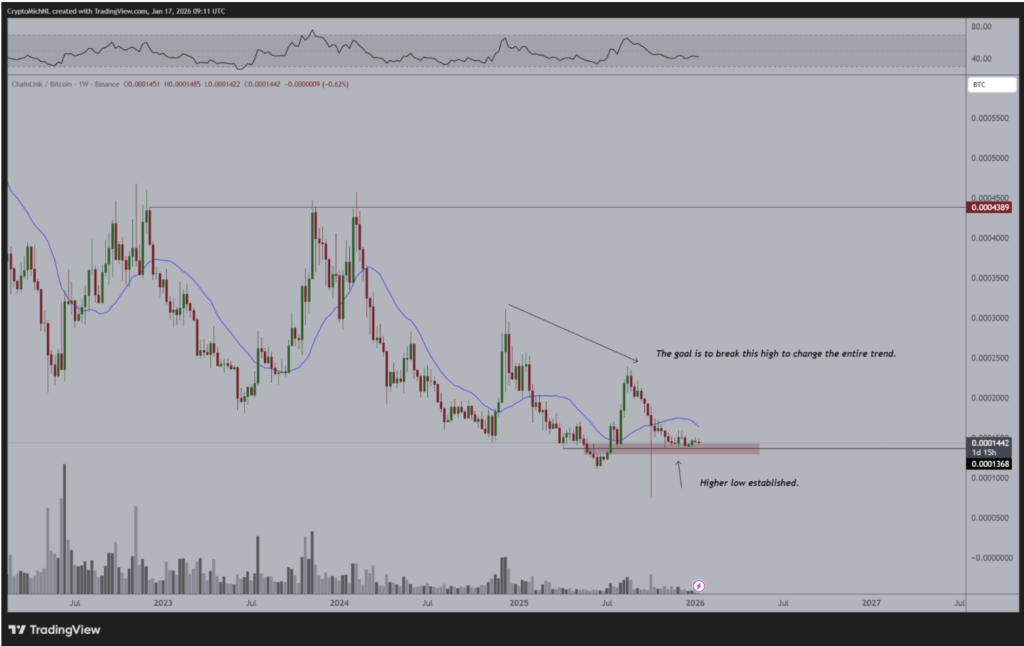
This time, something looks different. Van de Poppe pointed out that LINK may be forming its first higher low since the bear market, and it’s not just a talking point. You can actually see it. Instead of breaking down into fresh lows below the familiar $12.00–$12.50 zone, price dipped into support around $13.70 and stopped there. That doesn’t confirm a trend reversal on its own, but it does suggest that something is shifting beneath the surface. Changes like this tend to show up before big moves, not after them.
Why This Higher Low Is a Subtle but Important Signal
Looking closely at the recent price action, LINK pushed sharply into support, printed a long downside wick near $13.70, and then bounced. That area has since held up as a base. Sellers have tried, but so far they haven’t been able to force price lower.
That’s a meaningful difference compared to earlier phases of the downtrend. In the past, every bounce eventually gave way to lower lows below $13.00. This time, price stopped higher and began consolidating. Buyers are stepping in earlier than they used to, and that’s often how trend changes start, quietly, without much fanfare.
As long as LINK holds above the $13.50 to $13.70 range, pullbacks start to look more like controlled retests rather than warning signs. It’s not bullish euphoria, but it’s no longer pure weakness either.
The Level That Will Decide LINK’s Direction
That said, the chart isn’t pretending everything is solved. There’s still a clear hurdle overhead. The prior swing high around $16.50 to $17.00 is the level that really matters. Until LINK can break and hold above that zone, this move stays classified as a recovery, not a full reversal.
There’s also a key moving average sitting near $15.00 that has capped upside for months. LINK is pressing into that area again now. A clean move above $15.00, followed by acceptance, would increase the odds of a push toward $17.00. If price gets rejected again, it wouldn’t be surprising to see LINK chop sideways between roughly $13.70 and $15.00 for a while longer.
What Comes Next for LINK
Momentum indicators aren’t flashing extremes, and that’s actually a good thing. LINK isn’t overheated above resistance, and it’s not collapsing through support either. It’s sitting in a decision zone, the kind where the market has to prove whether this higher low actually matters.
If the base continues to hold and price starts challenging $16.50 and beyond, the structure finally begins to change in a meaningful way. Until then, this is the quiet part of the move. Pressure builds, patience gets tested, and eventually, the chart shows its hand.