
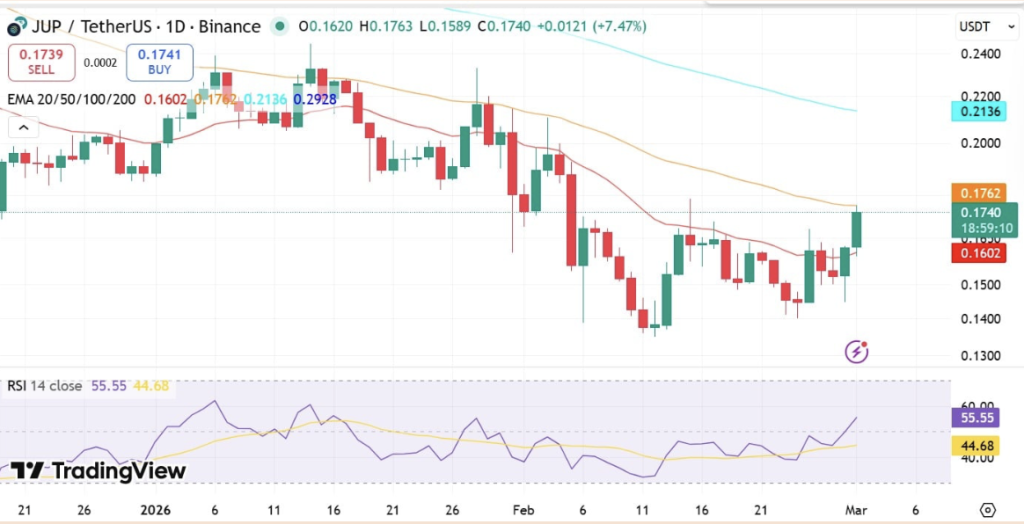
- JUP bounced from $0.14 to $0.176, flipping EMA20 and strengthening short-term momentum.
- Open Interest and derivatives volume surged, but Long/Short ratios show traders remain cautious.
- Rising spot exchange inflows could trigger a pullback toward $0.14 if selling pressure increases.
Jupiter staged a sharp rebound after slipping to $0.14, climbing to a two-week high near $0.176 in what felt like a sudden shift in tone. The move wasn’t gradual. It snapped higher, flipping its short-term moving averages, including the EMA20, and signaling that buyers had stepped back in with conviction.
At the time of writing, JUP trades around $0.172, up more than 17% on the daily chart. That adds to its weekly gains and reinforces the idea that momentum is building again. The speed of the bounce suggests this wasn’t just passive recovery. It looked like opportunistic accumulation.
Network Activity Surges as Price Recovers
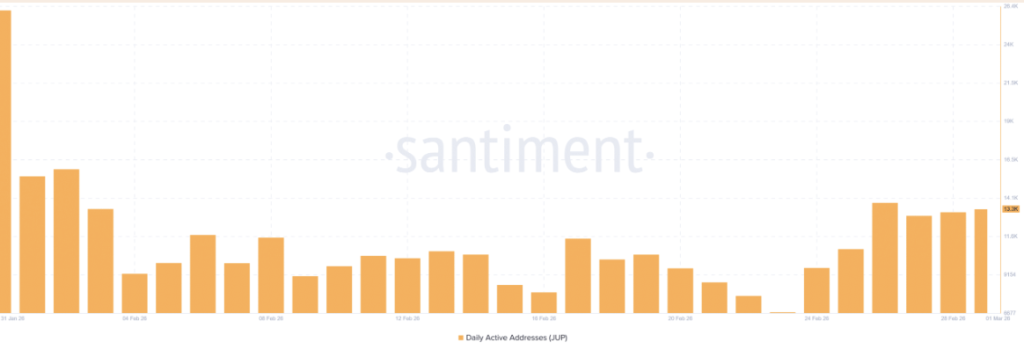
After touching $0.14, JUP saw a noticeable wave of renewed demand. New participants appeared to treat the dip as a discount window. Active Daily Addresses jumped to 13.3k, marking a roughly 200% increase. That spike signals growing network usage, not just speculative positioning.
When price rebounds alongside on-chain activity, it adds weight to the move. It doesn’t guarantee continuation, but it suggests the rally isn’t purely thin liquidity or short covering. There’s engagement behind it.
At the same time, capital began flowing back into derivatives markets.
Futures Inflows Rise, But Short Bias Lingers
On the Futures side, Jupiter recorded $25.01 million in inflows versus $23.05 million in outflows. That pushed netflow up nearly 194% to $1.96 million, reflecting rising demand for leveraged exposure. Open Interest climbed 22% to $44.07 million, while derivatives volume surged 53% to $101 million. Those numbers point to growing trader participation.
However, positioning data reveals a split sentiment. The Long/Short Ratio across Binance and OKX remains below 1, hovering around 0.99 overall. Binance sits near 0.93, and OKX around 0.89. A ratio under 1 indicates more traders are leaning short than long, which suggests a chunk of the market expects another pullback.
That creates tension. Momentum is rising, but skepticism hasn’t disappeared.
Momentum Indicators Flash Bullish, For Now
Technically, Jupiter’s Relative Strength Index has climbed to 55, pushing into mildly bullish territory. The price has already flipped EMA20 and is now testing EMA50. When price begins reclaiming key moving averages while RSI trends upward, it typically signals growing buyer confidence.
If momentum holds and fresh capital continues entering the market, JUP could solidify above EMA50 near $0.17. From there, a move toward $0.20 becomes realistic, followed by a potential test of EMA100 near $0.21. That’s the optimistic path.
But there’s friction building underneath.
Spot Selling Threatens the Rally
While derivatives traders increased exposure, spot market behavior tells a slightly different story. Following the rebound, some previously underwater holders appear to be taking the opportunity to exit. Exchange inflows outpaced outflows, with Spot Netflow rising 145% to roughly $677k. Total inflows reached $5.6 million compared to $4.9 million in outflows.
That suggests some profit-taking, or at least risk reduction, is underway. If spot selling accelerates, it could cap the rally before it fully matures.
For now, Jupiter’s structure leans bullish in the short term. Momentum has improved, and network activity supports the bounce. But if exchange inflows continue to climb and short interest remains elevated, a retracement toward $0.14 can’t be ruled out. In crypto, strong rallies often face one more test before deciding where to go next.