
- Dogecoin is consolidating after a long bearish trend while testing key resistance near $0.12
- RSI and MACD indicators both show improving bullish momentum for DOGE
- Trading volume and Open Interest surged as trader participation increased across the market
Dogecoin appears to be slowly shifting away from the prolonged bearish trend that dominated much of late 2025 and early 2026. After months of printing lower highs and steadily losing momentum, DOGE has now entered a tighter consolidation phase, with price action stabilizing around the $0.09 to $0.11 region.
The daily chart shows the memecoin trading sideways for weeks, which many traders view as a possible accumulation range before a larger move develops. During this consolidation period, volume gradually cooled off too, usually a sign that aggressive selling pressure has weakened. Now though, DOGE is starting to test the upper edge of that range near the $0.11 to $0.12 resistance zone, and momentum is quietly building underneath the surface.
Some analysts believe a confirmed breakout above that area could mark the beginning of a broader bullish reversal structure.
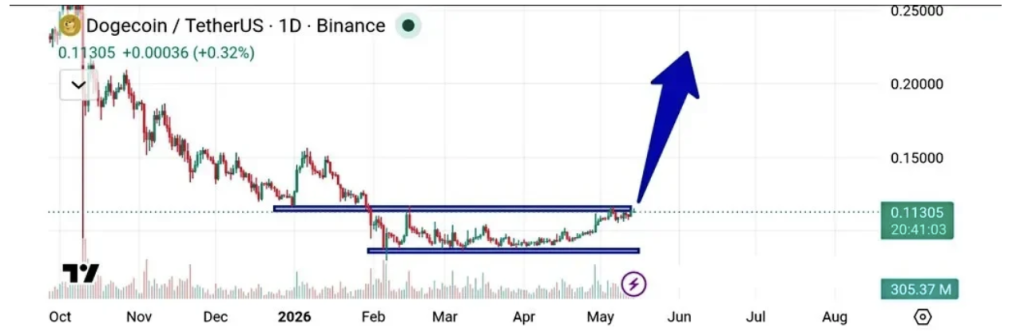
Analysts Eye Higher Targets if Resistance Breaks
According to crypto analyst 0xNeena, a strong daily close above the current resistance range could open the door toward several higher targets. The first upside levels being watched sit around $0.15 and $0.18, while stronger continuation could eventually push DOGE toward the $0.20 region and potentially even the $0.25 zone later on.
Still, confirmation matters here. Right now the market is showing early bullish signs, but buyers need to maintain pressure consistently for the breakout structure to fully develop. Without sustained volume and momentum, the move risks fading back into consolidation again.
If DOGE fails to clear resistance convincingly, traders expect price could revisit lower support levels near $0.10. That support area has become extremely important over recent months because it repeatedly prevented deeper breakdowns during weaker market conditions.
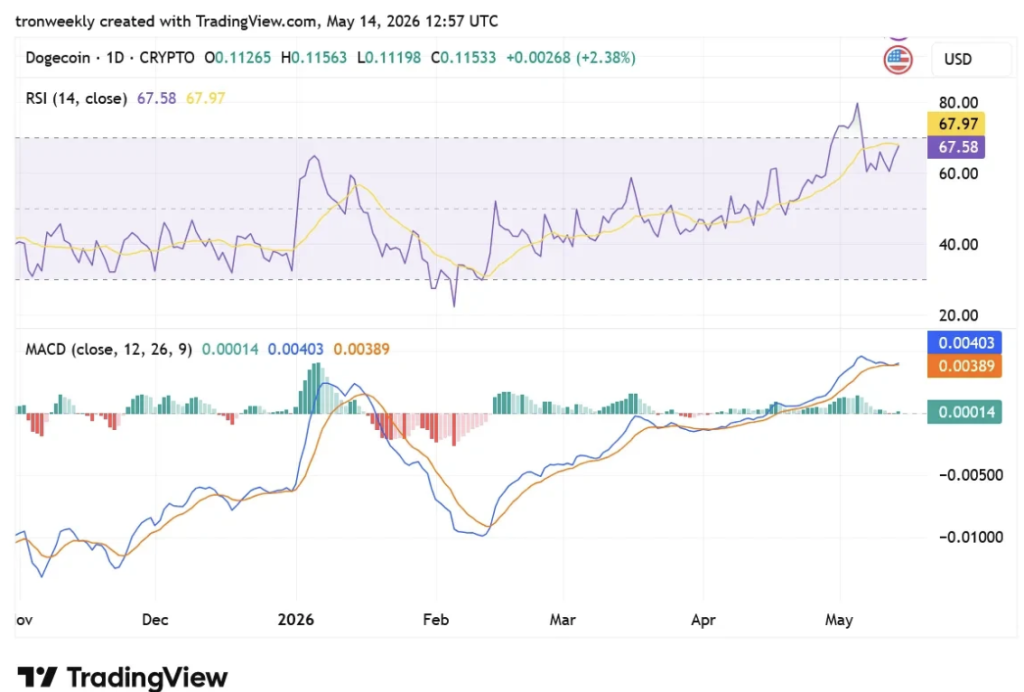
RSI and MACD Flash Improving Momentum
Momentum indicators are beginning to tilt more bullish as well. The Relative Strength Index, or RSI, currently sits around 67.43 while the signal line hovers near 67.95. That places DOGE close to overbought territory, though not quite there yet. Usually, readings near 70 suggest strong buying momentum but also hint the market may eventually cool off if buyers become exhausted.
Meanwhile, the MACD indicator continues supporting the bullish narrative. The MACD line recently climbed above the signal line, with the histogram remaining positive at roughly 0.00014. In simple terms, that setup often reflects strengthening bullish momentum following a correction phase.
The widening gap between those indicators suggests traders are gradually regaining confidence. But again, volume probably becomes the deciding factor from here. Technical setups can look great temporarily, then fail quickly without enough participation backing the move.
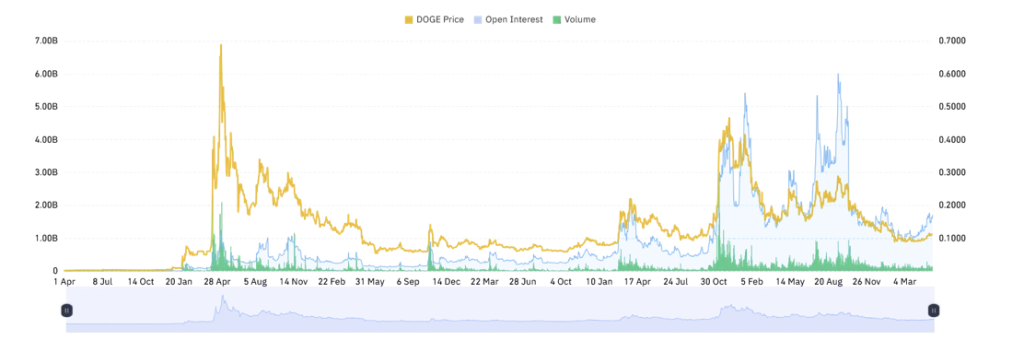
Trading Volume and Open Interest Surge Higher
Data from CoinGlass shows participation across the Dogecoin market has increased sharply during the latest move. Trading volume jumped more than 37%, climbing to approximately $3.67 billion. That kind of spike usually reflects stronger trader activity, improving liquidity, and rising short-term speculation.
Open Interest also moved higher, increasing around 7.44% to roughly $1.83 billion. Rising Open Interest often signals that new positions are entering the derivatives market instead of traders simply closing old ones. In many cases, that’s viewed as a positive sign because it suggests confidence in the current trend is expanding.
For now, Dogecoin sits at a pretty critical point technically. Momentum indicators are improving, volume is increasing, and derivatives activity is heating up. But until DOGE can decisively break above resistance and hold those gains, traders will probably remain cautious despite the growing optimism.