
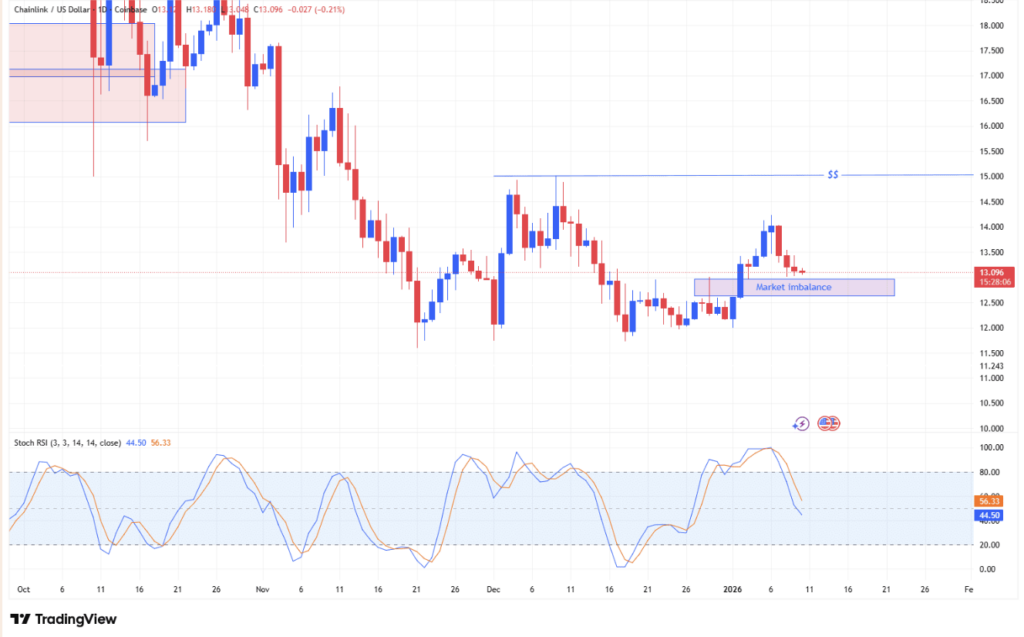
- LINK is retracing into a historically important $13 imbalance zone
- On-chain and momentum data suggest positioning, not panic selling
- Liquidity near $15 could act as a short-term magnet if momentum builds
Nasdaq and CME Group’s latest announcement didn’t go unnoticed. The two giants revealed the launch of the Nasdaq CME Crypto Index, an index built around leading digital assets like Bitcoin, Ethereum, and Chainlink. For LINK, that timing is interesting, maybe even a little uncomfortable, as the token sits at a technically sensitive point on the chart.
This kind of institutional validation can shift narratives quickly, but price still has to do the work. And right now, LINK is approaching an area where decisions tend to get made.
A Return to a Familiar Market Gap
At the time of writing, LINK was pulling back into a key imbalance zone around $13. This level has acted as a launchpad during several of LINK’s previous rallies, making it a familiar battleground for both buyers and sellers. As price slipped back into that zone, selling pressure started to show signs of fatigue rather than acceleration.
Instead of aggressive dip buying, the tape suggested something quieter. Buyers appeared cautious, testing liquidity rather than rushing in all at once, which often happens near meaningful inflection points.
Momentum indicators helped reinforce that idea. On the charts, the Stochastic RSI drifted toward oversold territory, a region that frequently aligns with seller exhaustion. When this indicator reaches those levels during periods of broader market stability, reversals tend to become more probable, though never guaranteed.
On-Chain Activity Hints at Positioning, Not Panic
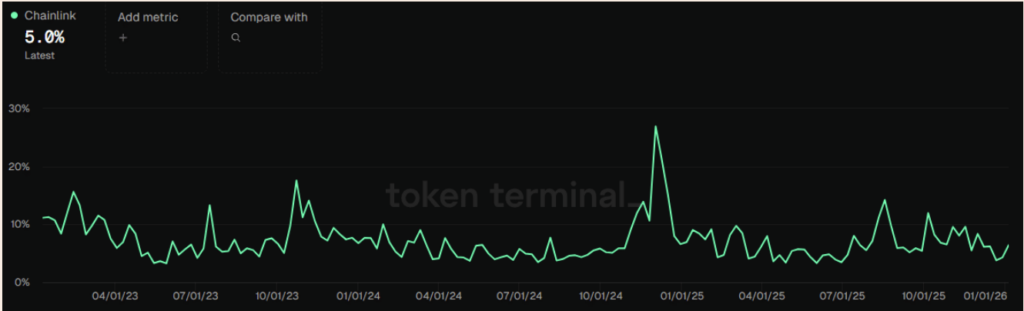
On-chain metrics added another piece to the puzzle. LINK’s circulating token turnover climbed by roughly 5% over the past 24 hours, a move that stood out given the ongoing retracement. Typically, rising turnover during a pullback reflects tactical repositioning rather than widespread capitulation.
In this case, the increase suggested market participants might be gearing up for a directional move, not abandoning ship. That distinction matters, especially when price is sitting on historically reactive levels.
Liquidity Points to a $15 Target Zone
Liquidity data sharpened the near-term picture. Heatmap analysis showed a notable liquidity cluster worth around $1.32 million sitting near the $15 level. These clusters often behave like magnets, pulling price toward them once momentum starts to build.
If LINK manages to stabilize and push higher from the $13 zone, that $15 pocket becomes a logical short-term objective. It’s the kind of move that tends to unfold quickly once conditions align.
The Institutional Backdrop Adds Weight, but Price Decides
The institutional angle is hard to ignore. Nasdaq partnering with CME Group places Chainlink directly inside a regulated financial framework, and inclusion alongside Bitcoin and Ethereum subtly shifts how LINK is perceived. It no longer sits on the fringe of the altcoin universe, but closer to crypto’s core infrastructure layer.
Still, narratives don’t move markets on their own. The chart has the final word. For the bullish reversal case to stay intact, LINK needs to hold above that daily imbalance zone. Lose it, and the conversation changes, fast.