- Chainlink formed a descending broadening wedge pattern that analysts believe may lead to a bullish breakout.
- LINK reclaimed several key moving averages while open interest continues rising across derivatives markets.
- Traders are watching whether LINK can break major resistance and potentially target the $21 region.
Chainlink has started attracting fresh bullish attention after forming a technical setup that many traders believe could lead to a major breakout move over the coming weeks. While price action still faces several important resistance zones ahead, LINK has quietly regained momentum and pushed above multiple key moving averages, which is usually one of the first signs that market structure may be shifting again.
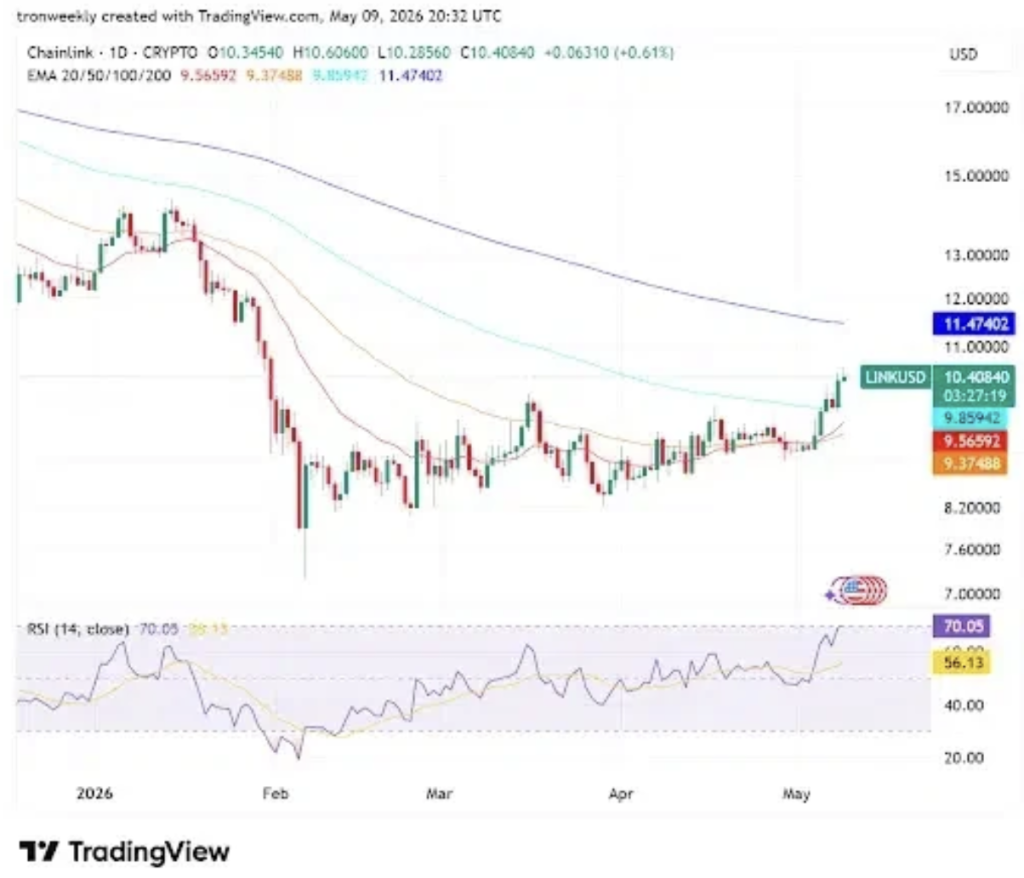
At the time of writing, LINK is trading near $10.40 after gaining roughly 1.1% over the past 24 hours. That move may not seem massive on the surface, but analysts are paying attention because the token has been recovering steadily from its earlier 2026 decline. More importantly, technical indicators now suggest buyers are slowly regaining control after months of weaker price action.
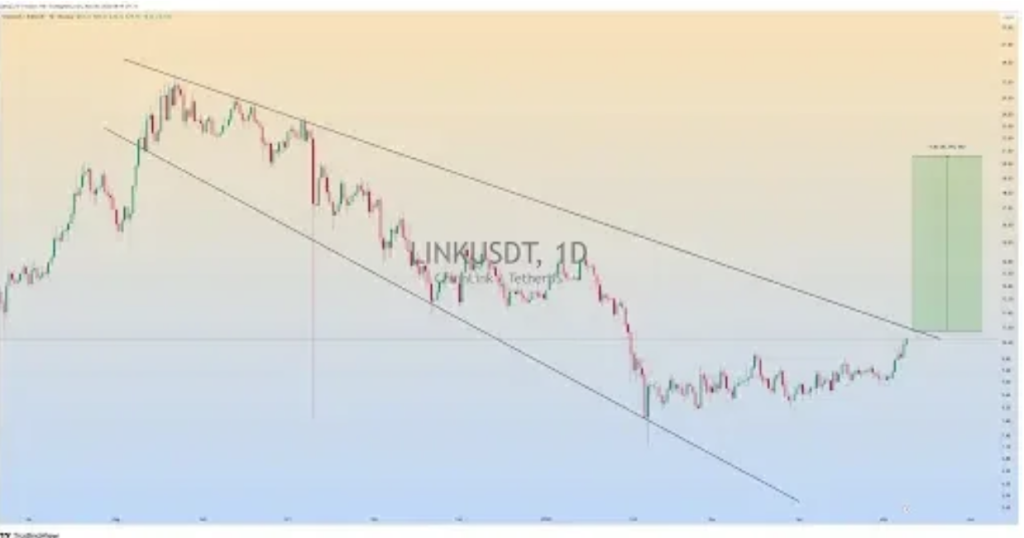
The broader setup currently revolves around a descending broadening wedge pattern forming on the daily timeframe. These structures often appear during periods where volatility expands while downward momentum weakens, and in some cases they can eventually lead to strong upside reversals once resistance finally breaks.
Derivatives Data Shows Traders Returning To LINK
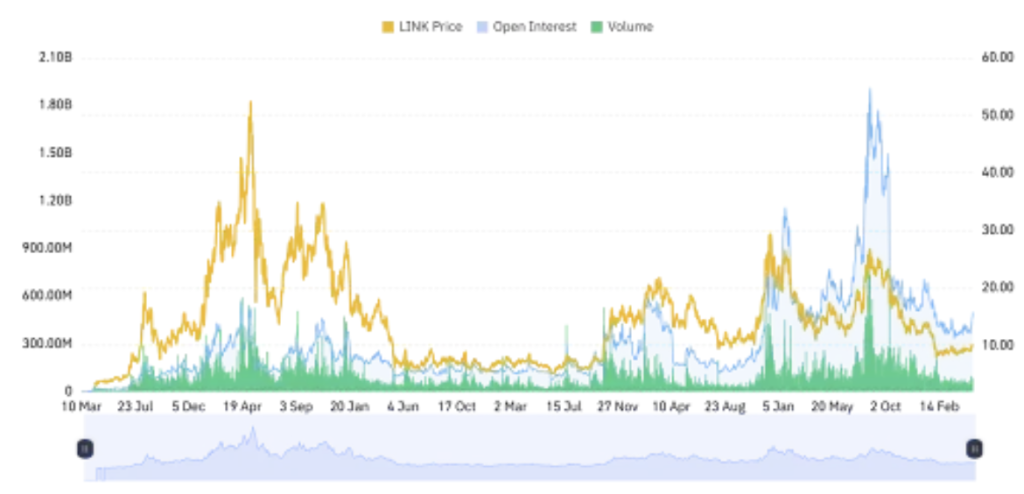
According to Coinglass data, open interest for Chainlink has climbed by roughly 1.3%, reaching around $498 million. Rising open interest generally signals growing trader participation because it shows more positions are being opened across the derivatives market. In LINK’s case, the increase suggests sentiment may be slowly improving as traders begin positioning for a larger move.
At the same time though, trading volume has actually dropped more than 20%, now sitting near $551 million. That creates a somewhat mixed outlook in the short term. Higher open interest paired with lower volume can sometimes signal cautious positioning rather than full conviction, meaning traders are entering the market but still waiting for stronger confirmation before becoming aggressive.
In other words, the market appears interested in LINK again, but not fully committed just yet. That hesitation makes sense honestly, especially considering the token still faces major resistance overhead and broader crypto volatility remains elevated.
Still, analysts believe the current structure looks much healthier than it did several months ago when LINK was struggling to stabilize after its earlier breakdown phase.
Analysts Eye Massive Breakout If Resistance Finally Breaks
Crypto analyst Clifton Fx recently highlighted Chainlink’s broadening wedge formation, pointing out that price swings inside the pattern have become wider even as the overall trend remained under pressure. According to the analyst, this type of structure often suggests sellers are gradually losing control while buyers begin absorbing supply underneath the surface.
The key now is whether LINK can break above the wedge’s upper resistance line with strong volume and momentum confirmation. If that happens, some technical analysts believe the breakout could trigger a much larger upside expansion phase.
Based on measured move projections tied to the wedge structure, analysts are discussing potential upside ranging between 100% and 150% from current levels. That places the $21 region firmly on the radar as a possible longer-term target if bullish momentum accelerates properly.
Of course, those kinds of moves rarely happen in straight lines. Even bullish breakouts tend to experience pullbacks, consolidation phases, and resistance battles along the way. But the fact that analysts are even discussing those targets again shows how sentiment around Chainlink has started improving compared to earlier in the year.
Technical Indicators Suggest Strength, But Risks Still Remain
Data from TradingView also shows LINK reclaiming several important moving averages after establishing a base near $7.60 earlier this year. Since then, bullish candles have pushed price back above the 20-day, 50-day, and 100-day EMAs, signaling a meaningful structural shift compared to the prolonged weakness seen previously.
Momentum indicators currently support the recovery narrative too. LINK’s Relative Strength Index sits around 70, which technically places the asset in overbought territory. That usually increases the likelihood of short-term consolidation or temporary pullbacks before another major move higher can continue.
One of the biggest resistance areas ahead remains the 200-day EMA near $11.47. Traders are watching that level very closely because reclaiming it would strengthen the broader bullish structure significantly. On the downside, maintaining support above the 100-day EMA remains important for preserving the recovery trend.
For now, Chainlink appears to be entering a critical phase where bullish momentum is building, but confirmation still matters. If buyers can maintain strength and push through resistance cleanly, LINK could begin testing much higher levels over the coming months.