
- BONK’s price action is at a pivotal point, with key support and resistance levels that will determine the next move
- If BONK fails to maintain support at 0.00003256 (0.618 Fibonacci retracement), the price could move lower, potentially testing 0.00002494 (0.786 Fibonacci level)
- A breakout above the descending wedge resistance, particularly above 0.00003790 (0.5 Fibonacci retracement) with increasing volume, would be a strong bullish signal
As the cryptocurrency market continues to evolve and fluctuate, BONK, a relatively new entrant, finds itself at a critical juncture. The currency’s price action is currently under scrutiny, with key support and resistance levels playing determining roles in its next move. This article delves into a detailed analysis of BONK’s price action, providing insights into potential breakout levels and whether a recovery or a deeper drop is in sight.
Current State of BONK’s Market Position
BONK is presently in a corrective phase, consolidating within a descending wedge pattern. The market structure indicates a potential breakout, but a failure to hold support could lead to a deeper correction, potentially targeting lower Fibonacci levels. The price is currently testing a key support level near the 0.618 Fibonacci retracement.
BONK Price Analysis
The daily chart of BONK exhibits an impulse move that peaked at 0.60 on November 20, followed by a corrective phase marked by a descending channel. The price has recently tested support around 0.000025, corresponding with the 0.786 Fibonacci retracement level, and is now consolidating above this zone. This pattern of lower highs and higher lows is characteristic of a descending triangle, which could either signal a further drop or a potential recovery.
Predicted Outlook for BONK
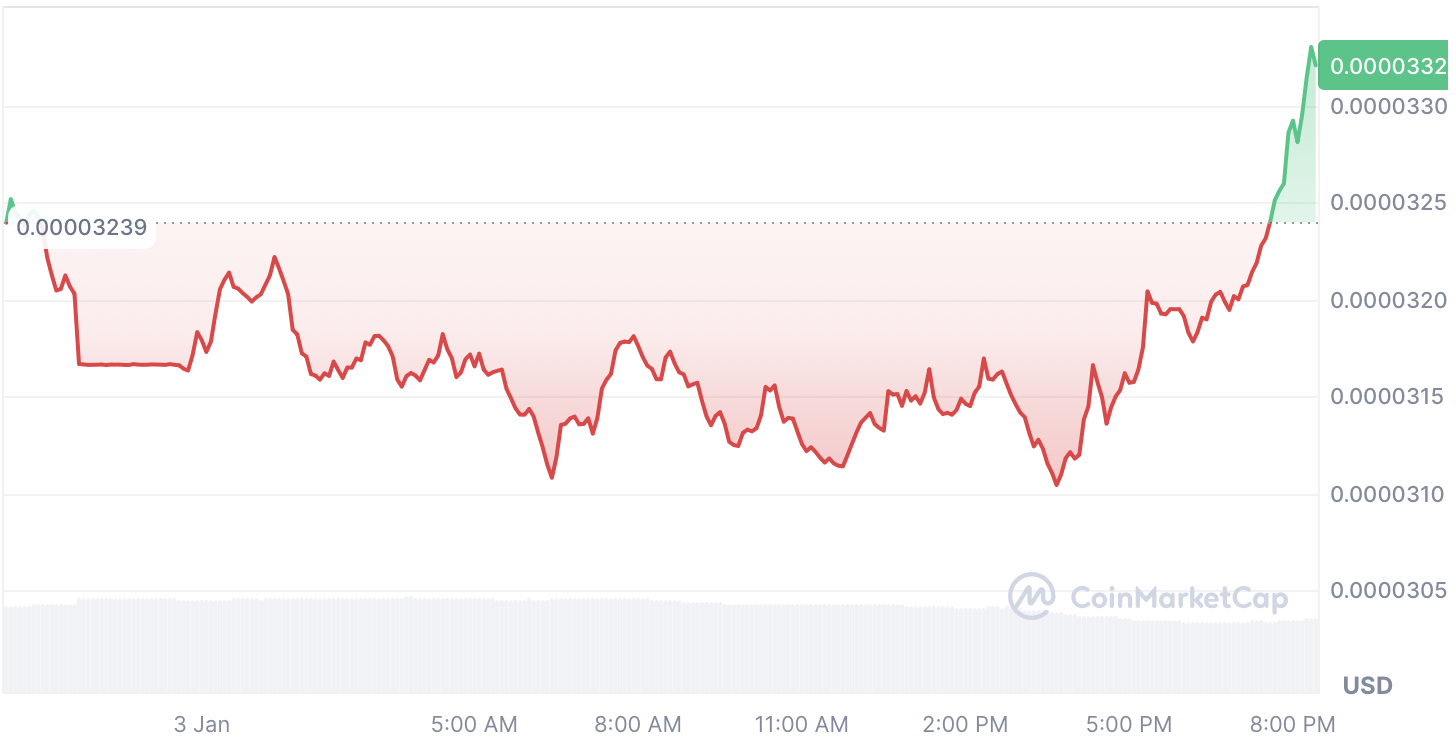
When looking at the hourly chart, the price is testing the lower boundary of the descending wedge near the 0.618 Fibonacci retracement at 0.00003256. This support level is key to the current price action, and a breakdown from this point could lead to further downside. However, if the price breaks above the descending wedge resistance, it could initiate a price recovery with initial resistance lying at 0.00003790.
Key Levels to Watch
Investors should keep an eye out for support at 0.00003256 and 0.00002494, and resistance at 0.00003790, 0.00004325, and 0.00004987. Additionally, a breakout from the descending wedge could potentially signal the end of the corrective phase. The relative strength index (RSI) also plays a crucial role, with a bounce near oversold levels potentially indicating a bullish reversal.
Conclusion
The current state of BONK’s price action presents a pivotal moment for the cryptocurrency. Whether it is heading towards recovery or a deeper drop will depend on key support and resistance levels. Investors must closely monitor these levels and the RSI to make informed decisions. It is also crucial to remember that investing in cryptocurrencies carries significant risk and professional advice should be sought before making any investment decisions.