
- Bitcoin broke below key support levels, dropping over 6% in two days as selling pressure accelerated
- Volume expanded during the breakdown, signaling forced exits and broader deleveraging
- The 200-week moving average near $68K is now being watched as a key long-term support
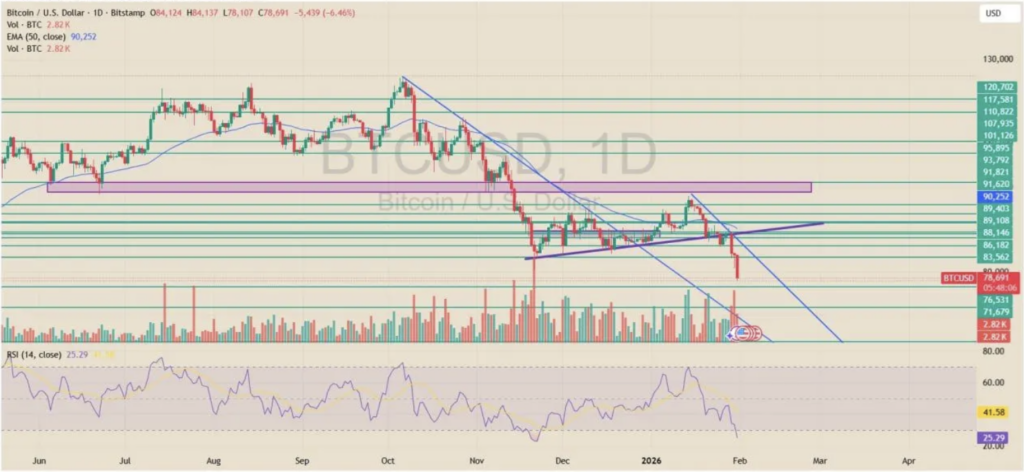
Bitcoin extended its selloff over the past two sessions, slicing through multiple technical levels as downside momentum picked up speed. What looked like a routine pullback quickly turned sharper, with sellers stepping in after a failed recovery attempt near local resistance. Once that bounce faded, price rolled over hard, and the move lower didn’t waste much time.
On the daily chart, BTC slid from the mid-$84,000 area to roughly $78,700. That’s a loss of about $5,400 in just two days, or roughly 6.4%, enough to shift sentiment noticeably. The rejection near resistance was the trigger, but the follow-through is what caught traders off guard.
Key Technical Levels Give Way
From a structural standpoint, the damage is clear. Bitcoin lost its rising support trendline that had been intact since late December, and once that line snapped, price fell straight through a cluster of horizontal supports between $86,000 and $82,000. At the same time, BTC dropped decisively below the 50-day exponential moving average, now sitting near $90,000 and acting as firm overhead resistance.
Volume expanded during the breakdown, which matters. This wasn’t a slow drift lower on thin liquidity. The increase suggests forced exits and accelerated deleveraging, with traders scrambling to cut exposure. So far, the daily candles show little in the way of aggressive dip buying, and there’s no clear reversal signal yet.
Momentum Weakens, Oversold Conditions Emerge
Momentum indicators have followed price lower. RSI has slipped toward the mid-20s, pushing Bitcoin into deeply oversold territory. Historically, readings like that can lead to short-term relief rallies, but they don’t guarantee anything on their own. Oversold can stay oversold longer than most expect, especially in fast-moving markets.
Looking ahead, the next visible support zone sits in the low-to-mid $70,000s. That area lines up with prior consolidation and the projected path of a descending channel visible on the chart. Until BTC can reclaim broken levels around $82,000 to $84,000, the broader bias remains tilted to the downside.
200-Week Average Comes Back Into Focus
Adding to the discussion, analyst James Wynn weighed in on X, arguing that Bitcoin’s “probable” destination sits near $68,000. That level aligns closely with the 200-week moving average, currently around $68,379, a long-term reference point many traders watch during deeper corrections. Wynn said he’s been flagging downside risk since the $120,000 area and views a move back toward the baseline as a kind of reset.
On the chart, Bitcoin appears to be rolling over from a prior peak, trading below a key overhead level near $96,500. Price is now pressing into a lower band that includes support around $80,500, with a broader demand zone sitting further below.
Wynn also mentioned the possibility of a sharper, fear-driven drop, floating $50,000 as an extreme lower scenario, though he noted he doesn’t expect price to fall beneath that. For now, that remains a personal outlook. From a pure chart perspective, the clearest long-term reference remains the 200-week moving average near $68K, a level the market may not ignore if downside pressure continues.