
- Ethereum’s Elliott Wave analysis suggests a bullish breakout, targeting $6100+ in the coming months.
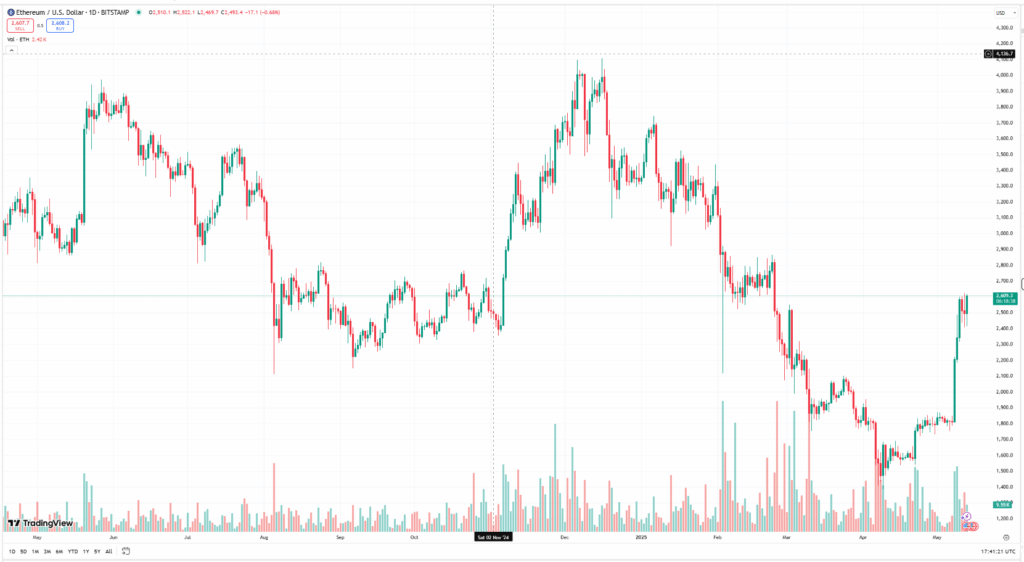
- ETH is now above key resistance levels, including the 50-day SMA and downtrend line, signaling a trend reversal.
- The failed fifth wave at $1085 indicates the broader correction is likely complete, setting up a multi-month rally.
Ethereum’s chart is setting up for a potentially explosive move, according to the Elliott Wave (EW) analysis. Previously, ETH was tracking a fourth wave correction – a running flat pattern – that appeared to be targeting a drop to $1085. But the bears couldn’t push it that low, leaving us with a failed fifth wave and a bullish reversal instead. Now, with the price above the 50-day SMA, the downtrend line, and a rising Ichimoku Cloud, ETH is positioned for a multi-month surge that could hit $6100+.
Short-Term Technicals Show Bullish Reversal
A month ago, ETH was in a clear downtrend. Fast forward to now, and things have flipped. The cryptocurrency is holding above key resistance levels – the 20-day SMA, 50-day SMA, and that long-standing downtrend line. The only obstacle left? The 200-day SMA, which is still acting as a ceiling. But with momentum building and the Elliott Wave count suggesting a fresh impulse wave, the path to $6100 is gaining traction.
What’s the Big Picture?
From a broader perspective, Ethereum’s massive rally from the 2020 low to the 2021 all-time high formed a flagpole. The ongoing consolidation pattern since then looks like a textbook bull flag, setting up for a breakout.
According to the EW count, this next wave up could see ETH rally by over 400%, pushing it well into the $6000s. The key support to watch? The 2019 high at $356 – as long as ETH holds above that level, the bullish thesis remains intact.