- Solana reclaimed its 100-day moving average for the first time in over 200 days.
- Analysts believe SOL could outperform Ethereum if the SOLETH support zone continues holding.
- Traders are now watching whether Solana can maintain momentum and push toward higher resistance levels.
Solana is beginning to flash early bullish signals again after reclaiming an important technical level and defending a critical support zone against Ethereum. The move hasn’t confirmed a full trend reversal yet, not even close honestly, but traders are paying attention because both the SOL/USD and SOL/ETH charts are starting to shift in a more constructive direction after months of weakness.
One of the biggest developments right now is Solana reclaiming its 100-day moving average for the first time in roughly 205 days. That may sound like just another technical indicator on paper, but historically these kinds of reclaim moves often signal that momentum is beginning to rotate back toward buyers. After spending months trapped under heavy resistance, SOL is finally attempting to push higher again.
At the same time, Solana’s performance against Ethereum is becoming another important story. Relative strength between major assets tends to matter a lot during broader market recoveries, and some analysts now believe Solana could be setting up to outperform ETH if current support levels continue holding.
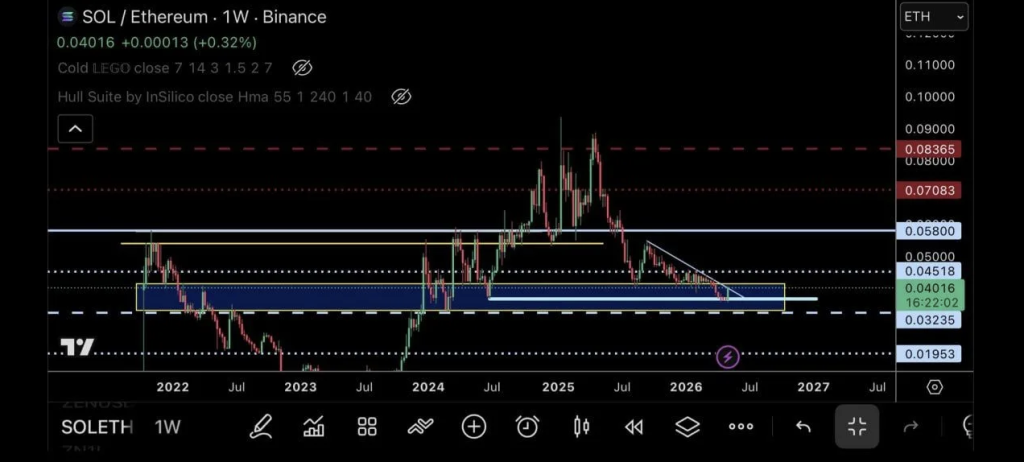
SOL/ETH Chart Holds Major Support Zone
On the weekly SOLETH chart shared by TraderSZ, Solana is currently sitting near the lower end of a long-term horizontal range that has acted as a major reaction area multiple times since 2021. The key support region falls roughly between 0.032 ETH and 0.040 ETH, and recent candles suggest buyers are actively trying to defend that zone instead of letting the pair break down further.
That matters because cross-pair strength can sometimes reveal market leadership before it becomes obvious on USD charts. When SOL starts gaining ground against ETH, it often suggests traders are rotating toward Solana more aggressively during recovery phases. In previous cycles, those shifts occasionally led to SOLUSD moving faster and harder than ETHUSD once broader bullish momentum returned.
TraderSZ said the SOLETH structure “looks bottomed,” though he also noted that confirmation still hasn’t fully arrived yet. A descending trendline continues pressing down on the pair, acting as the first major breakout test bulls need to overcome. If Solana can break above that downtrend cleanly on the weekly timeframe, confidence around potential outperformance would likely grow much stronger.
Still, there’s work left to do. SOL/ETH needs to reclaim higher resistance areas near 0.045 ETH and eventually around 0.058 ETH before traders can realistically call this a confirmed reversal instead of just early stabilization.
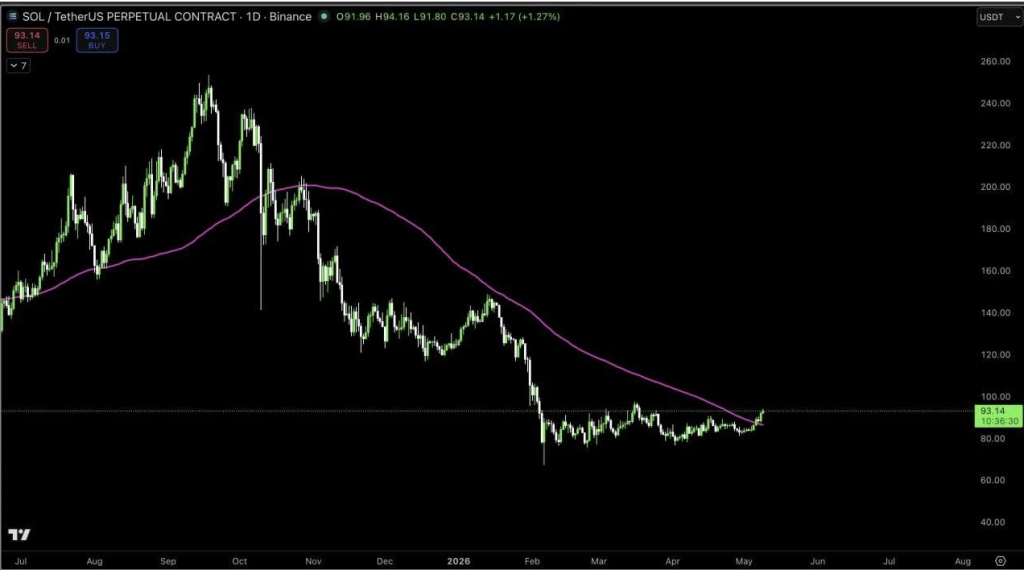
Solana Reclaims 100DMA After Months of Weakness
Another chart attracting attention came from analyst CRG, who pointed out that Solana recently reclaimed its 100-day moving average for the first time in more than 200 days. That’s a pretty significant technical shift considering how long SOL spent trading underneath that level during the broader downtrend.
The chart shows Solana collapsing from the $240-$250 area before entering a long period of sideways consolidation mostly between $80 and $100. Throughout that entire stretch, the 100DMA consistently acted as resistance, rejecting nearly every recovery attempt. Now though, price has finally pushed above it, signaling that short-term market structure could be changing.
In technical analysis, reclaiming a major moving average after an extended downtrend often suggests buyers are slowly regaining control. It doesn’t guarantee a sustained breakout, obviously, but it usually marks the first real step toward trend recovery. Traders watching momentum indicators see this as one of the stronger signals Solana has produced in months.
That said, analysts are still looking for proper follow-through. One clean breakout candle doesn’t fully change the trend by itself. SOL needs to continue closing above the 100DMA and hold it as support moving forward, otherwise the move risks turning into another failed breakout attempt.
Buyers Now Face the Next Major Resistance Test
For now, Solana appears to be transitioning away from long-term sideways accumulation and into an early-stage recovery phase. The next big challenge sits near the psychological $100 level, where sellers previously stepped in aggressively during earlier rebounds.
If SOL manages to hold above the reclaimed moving average while building momentum against Ethereum simultaneously, traders believe the asset could begin attracting much stronger attention again. Market participants often rotate quickly toward coins showing relative strength once confidence starts returning to crypto broadly.
But if the recovery stalls and SOL loses these newly reclaimed levels, sentiment could weaken just as fast. The current structure still depends heavily on buyers defending support and maintaining upward momentum over the coming weeks. Right now, the setup shows potential — but the market still wants confirmation before fully committing to the bullish narrative.