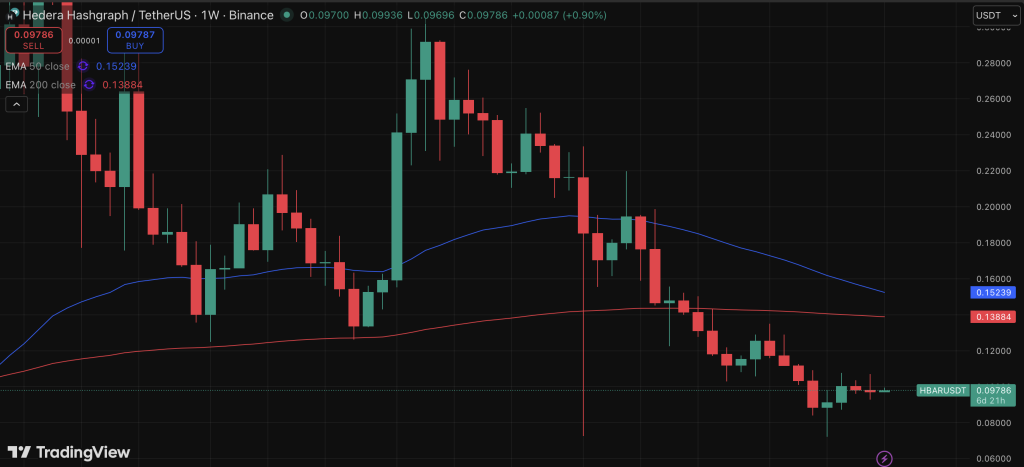
- HBAR is stabilizing between $0.088 and $0.10, with $0.12 acting as major resistance.
- Technical indicators suggest consolidation, not strong bullish or bearish momentum.
- A break above $0.12 could target $0.135–$0.15, while losing $0.088 exposes $0.072 and $0.065.
Hedera is back in headlines, though the price chart isn’t exactly celebrating. A senior U.S. transportation official recently secured a patent for a nationwide road usage system built on decentralized ledger technology, and notably, it’s compatible with Hashgraph. That’s not a meme coin catalyst. That’s infrastructure-level relevance.
And yet, HBAR is hovering near $0.10.
The broader crypto market pulled back as Bitcoin weakened, and HBAR followed like most altcoins tend to do. Price slipped toward the $0.10 region, while trading volume eased slightly. Interestingly, the cooling volume suggests aggressive selling may be slowing, not accelerating. Still, there’s no strong rebound either. It’s more of a cautious pause.
So right now, there’s a split narrative. On one side, serious long-term utility tied to public systems. On the other, short-term technical hesitation. Markets often do this, fundamentals and price rarely move in perfect sync.
HBAR Price Is Balancing on a Narrow Support Zone
On the 4-hour chart, HBAR has been drifting lower for months. Each bounce has been weaker than the last, which usually signals fading momentum. Price dipped toward $0.072 before recovering and finding support just under the $0.10 level.
Now, the $0.088–$0.10 range is the key battleground. HBAR is sitting almost directly on top of it. Buyers are defending the zone, but not aggressively. The structure feels flat, almost compressed, rather than impulsive or strong. It looks like stabilization, not breakout energy.
Overhead resistance remains clearly defined. The $0.11–$0.12 region has rejected price multiple times. Until HBAR pushes decisively above $0.12, the broader trend stays fragile. It’s not collapsing, but it’s not convincing either.
Indicators Suggest Consolidation, Not Conviction
Momentum indicators aren’t offering much clarity. RSI is hovering around the mid-range, neither oversold nor overbought. That leaves room for movement in either direction. Neutral territory.
MACD is flirting with a negative flip, but the histogram bars remain small. That tells us there’s no strong directional push from buyers or sellers. It’s almost as if the market is waiting for a catalyst.
DMI shows buyers and sellers are closely matched, with no clear dominance. Meanwhile, MFI is elevated but not extreme, indicating capital is moving in and out without strong conviction. Altogether, the indicators point toward consolidation. The chart feels like it’s holding its breath.
HBAR Price Targets to Watch This Week
If HBAR continues to hold above the $0.088–$0.10 support zone, the next level to watch is $0.11. A sustained break above $0.12 could open the path toward $0.135, where previous structure suggests stronger interest may appear.
Should bullish momentum build beyond that, $0.15 becomes the next larger technical target. That would require a noticeable shift in sentiment, though, not just incremental buying.
On the downside, losing $0.088 would re-expose the $0.072 level. If that fails, the next support area sits near $0.065. Those are the levels that would shift the tone more decisively bearish.
For now, HBAR is trying to stabilize. The government patent story strengthens the long-term case, no doubt about it. But in the short term, price still needs to prove itself. A push above $0.12 would change the mood quickly. A slip below support, and the patience of buyers might start to thin.