
- Dogecoin is holding a key $0.10 support zone on the monthly chart, marked as a long-term structural base.
- A tightening four-hour triangle pattern signals volatility compression that often precedes a sharp breakout.
- If $0.10 fails, the next major support sits near $0.08, aligning with Fibonacci and trendline confluence.
Dogecoin is hovering right around the $0.10 mark, and traders can feel the tension building. On lower timeframes, price is squeezing into a tighter range, while on higher timeframes it’s sitting inside what some are calling a long-term “best buy” zone. That mix — compression below, structural support above — tends to matter. And with a monthly close approaching, positioning suddenly feels more deliberate than random.
Monthly Chart Highlights a Structural Base
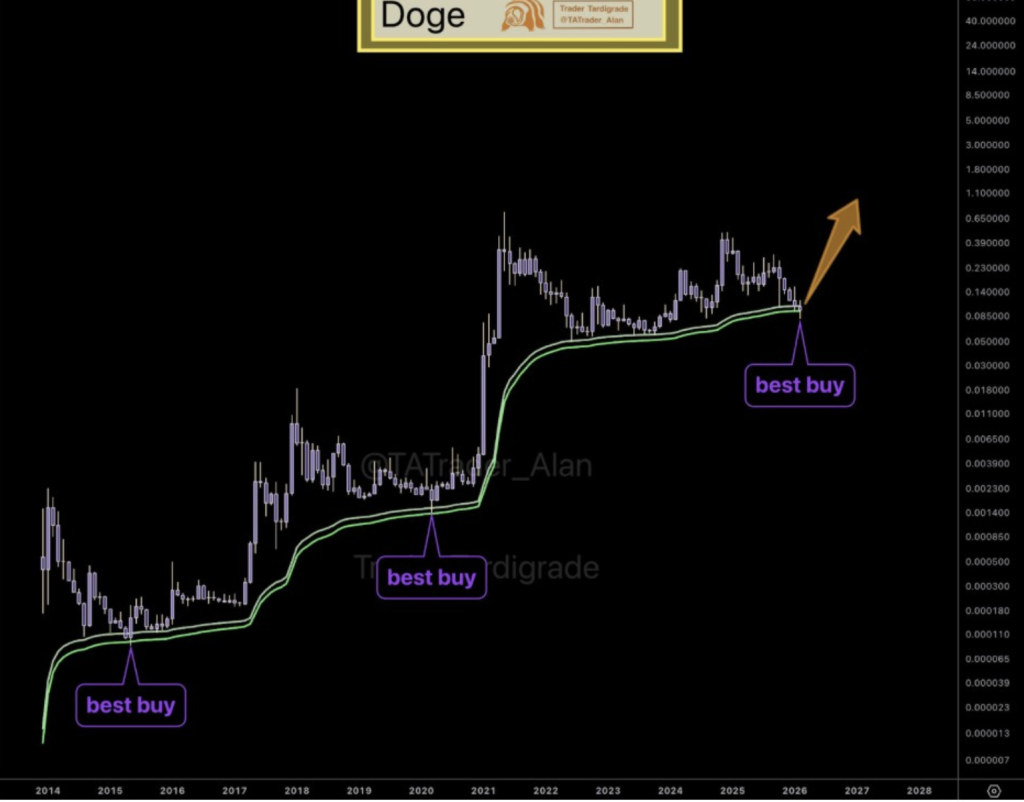
Trader Tardigrade’s monthly chart places DOGE inside a clearly defined support band that has acted as a floor in previous cycles. The area is marked as a “best buy” region, not because price must explode immediately, but because historically this is where accumulation has happened. The green rising support zone beneath price has quietly strengthened over time, and DOGE is still holding it.
What stands out isn’t timing, it’s location. Previous cycle peaks and long consolidations sit far above current price, almost reminding traders how extended the upside can get when momentum returns. For now though, the focus is simple: can Dogecoin close the month firmly inside this base and maintain structure? If it does, the bigger picture remains intact, even if the short term keeps chopping around.
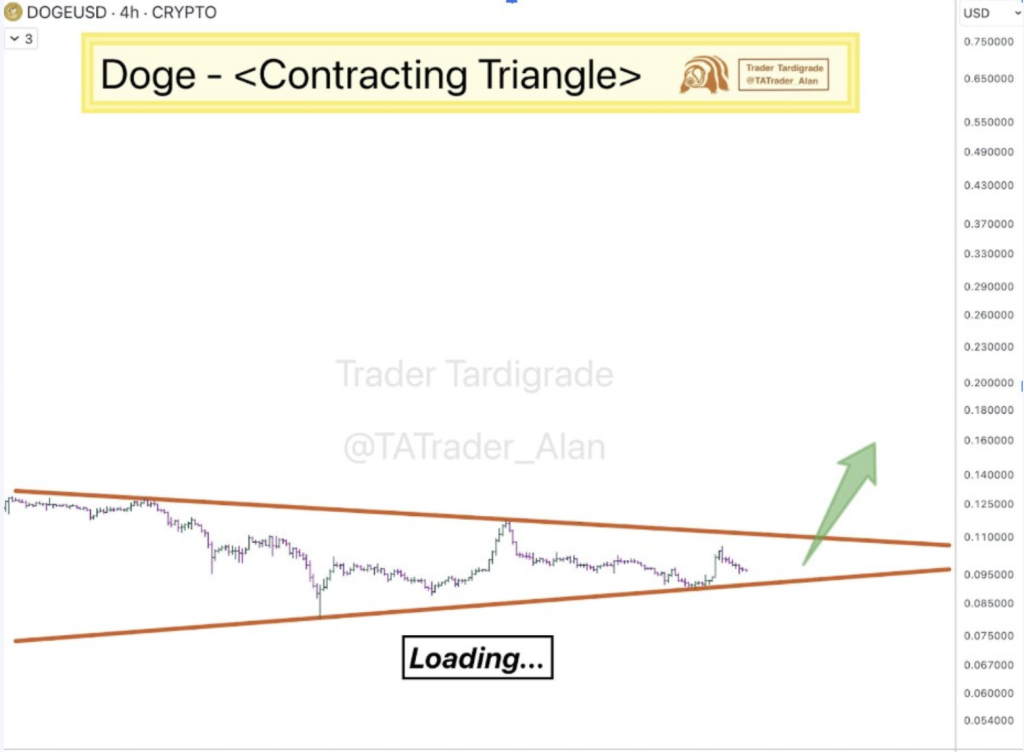
Short-Term Triangle Signals Pressure Building
Zooming into the four-hour chart, the structure tightens considerably. Highs are drifting lower, lows are pushing higher — a classic contracting triangle. Volatility is compressing, and markets rarely stay quiet for long.
The apex is approaching, and that usually means a breakout is coming. Direction isn’t guaranteed, of course, triangles can break either way. But with price coiling near $0.10, that psychological level becomes the pivot. A break above the upper boundary could pull attention back toward resistance around $0.105 and beyond. A breakdown, on the other hand, would shift focus lower pretty quickly.
The $0.105 Rejection Still Lingers
Another short-term chart showed a sharp V-shaped bounce that briefly pushed DOGE toward $0.105 before sellers stepped in. The spike looked aggressive, almost vertical, but it didn’t stick. Profit-taking followed, and price slipped back toward the $0.1000 region where it’s now hovering.
There’s visible supply overhead. Failed attempts to hold above $0.105 tend to leave a memory in the market, and traders notice that. Until DOGE reclaims that zone with convincing volume, momentum remains muted. Still, holding $0.10 prevents deeper weakness — it’s a balance right now, bids below, sellers above, pressure building in between.
Weekly Support Waits Near $0.08
On the weekly timeframe, there’s another layer to consider. A 0.786 Fibonacci retracement sits near $0.0806, lining up with a previous double bottom and a rising trendline. That confluence creates a secondary support zone if short-term structures fail.
Some analysts also point out that price is still below the 200-week moving average, which historically marks long-term value areas for DOGE. If $0.10 breaks decisively to the downside, $0.08 becomes the next serious level to watch. For now, though, Dogecoin is compressing at a key inflection point — sitting on higher timeframe support while coiling on lower ones. The move is coming. The only question is which way it snaps first.