- Solana is consolidating between strong resistance at $88–$90 and key support near $83.50 and $76.
- A breakout above $90 could accelerate upside momentum, while rejection may send price back toward mid-range support.
- Higher timeframe charts suggest the $75–$85 zone could act as a long-term base, but a break below $70 would weaken the bullish outlook.
Solana is sitting at one of those uncomfortable crossroads. The token trades around $85.95 at the time of writing, down roughly 4% on the day, yet still holding a modest 5% gain over the past week. That kind of mixed signal — red today, green on the week — usually means one thing: compression. With daily trading volume hovering near $5.2 billion and market cap just under $49 billion, participation hasn’t dried up. If anything, traders are watching more closely.
Price is tightening between a stubborn ceiling above and a well-defined floor below. And when ranges get this narrow, they don’t stay quiet forever.
Resistance Keeps Slapping the Ceiling
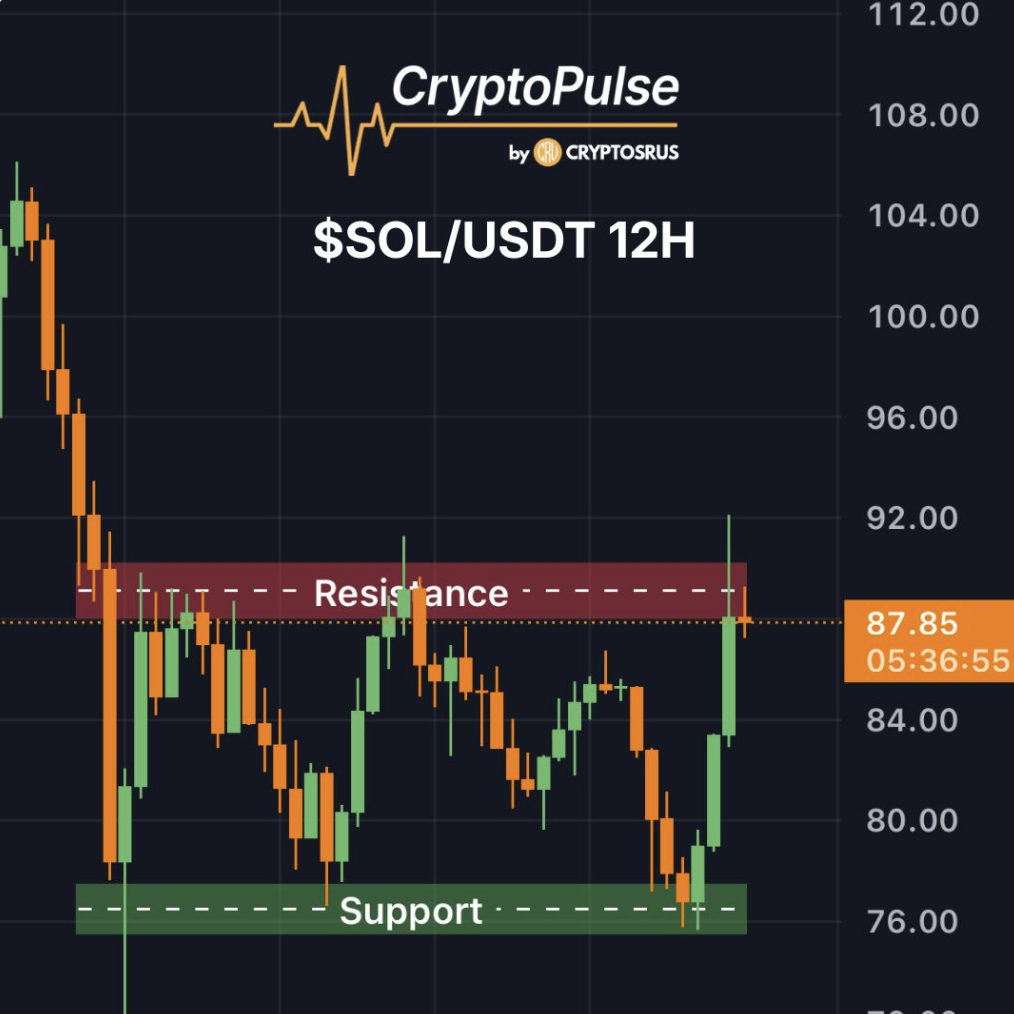
On the 12-hour chart, the $88 to $90 zone stands out like a wall. CryptoPulse flagged it as the key resistance band, and recent price action seems to agree. After bouncing cleanly from $76 support, Solana marched back up — only to hesitate again just beneath $90.
That hesitation matters. Repeated rejection at the same level usually signals active sellers defending their ground. Bulls have tested it, poked it, leaned on it… but they haven’t cracked it. Not yet.
If buyers manage a decisive break above $90, momentum could accelerate quickly. Breakouts from tight ranges often move fast because trapped shorts cover and sidelined traders pile in. But if the level holds again, rotation back toward the $81 mid-range becomes likely. And a deeper rejection could drag price right back to the $76 demand zone.
For now, the range remains intact. Choppy conditions are still the base case.
Micro Support Is Doing Heavy Lifting
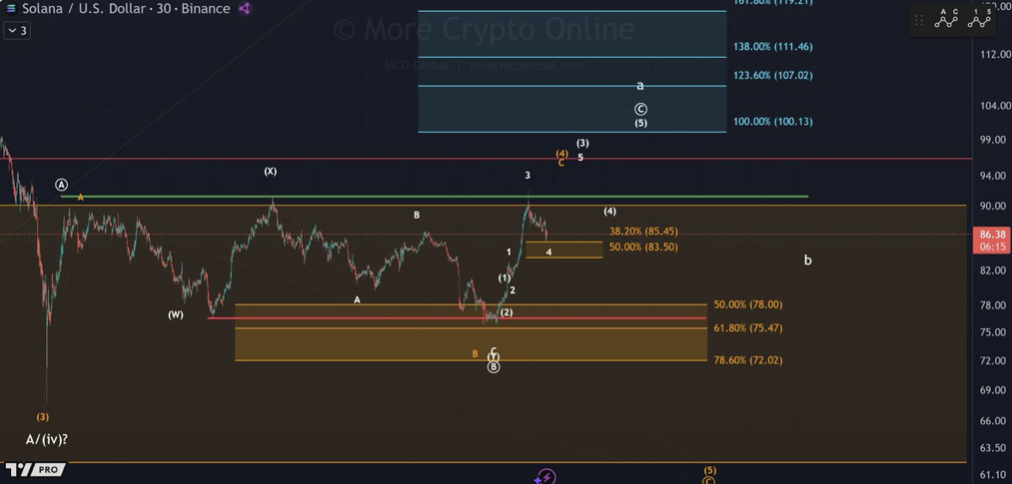
Zoom in a bit and $83.50 becomes the level to watch. Morecryptoonl points to this area as critical micro support, lining up with the 50% retracement and sitting near the 38.2% retracement around $85.45. It’s not a random number — it’s technical confluence.
As long as Solana stays above $83.50, analysts lean toward one more attempt at the $90 to $94 range. That push, structurally speaking, could complete a fifth-wave advance in the current formation. Momentum would still be intact.
But if price slices directly into $83.50 without hesitation, that changes the tone. A deeper wave-four pullback could unfold, raising the probability of revisiting $78 — or even $75.47. Intraday reactions around this pivot are crucial. A strong defense keeps bulls engaged. A weak bounce invites pressure.
Bigger Picture: Is a Bottom Forming?
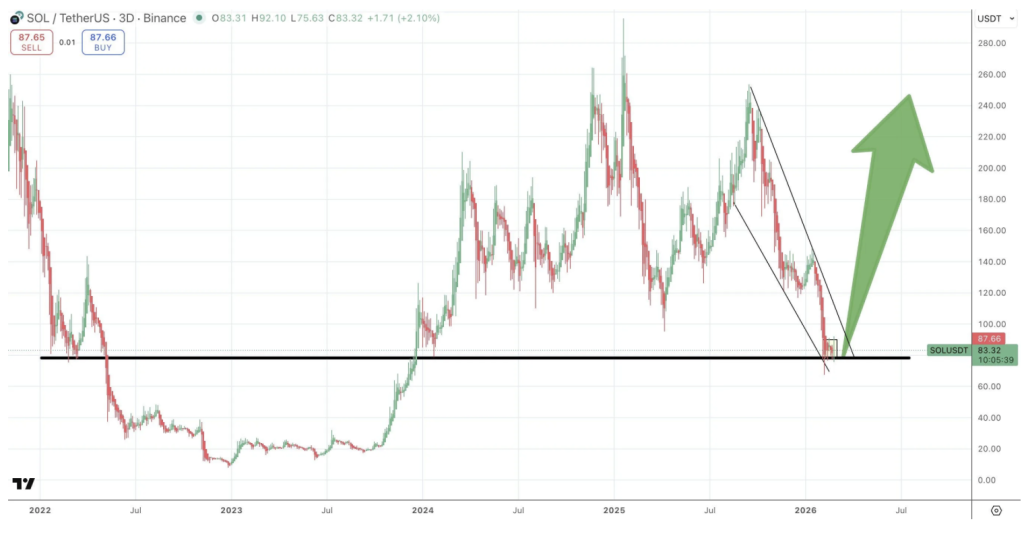
Step back to the three-day chart and the perspective shifts. Analyst Satoshi Flipper highlights the $75 to $85 region as major historical support. This band previously acted as resistance in 2022, flipped into support in early 2024, and now it’s being tested again after Solana’s steep drop from $240 highs.
There’s something subtle happening here. Descending trendline pressure is converging into the same demand zone, while bearish candles are shrinking in size. That often signals fading selling momentum — not explosive bullishness, but exhaustion.
If $75 holds firmly, projections point toward a relief rally into the $120 area. Beyond that, sustained recovery could open the door to $160–$180 later on. But that scenario depends entirely on the floor staying intact. A clean break below $70 would weaken the bullish thesis significantly and expose $55.
Right now, Solana isn’t trending. It’s coiling. And markets that coil this tightly rarely stay quiet for long.