
- Dogecoin has held a descending daily trendline across six candles, but lacks strong volume confirmation for a breakout.
- A long-term on-chain metric shows over 1,100 historical days traded above the current price, a record level for DOGE.
- The combination of structural support and widespread unrealized losses places Dogecoin at a potential cycle turning point.
Dogecoin is flashing two very different signals right now, and that’s what has analysts leaning in. On the surface, price is holding a key descending trendline on the daily chart. At the same time, a long-term on-chain metric just printed a reading never seen before in DOGE’s history.
Put together, it creates a strange mix of caution and opportunity. The structure isn’t broken. But it isn’t convincing either.
Trendline Holds, But Buyers Feel Hesitant
DOGE has tested a descending trendline across six consecutive daily candles. Each time, price managed to stay above support. Technically speaking, that keeps the bullish structure intact. Crypto analyst Trader Tardigrade pointed this out, noting that as long as the line holds, the setup can’t be dismissed.
Still, something feels… muted.
The recent bounces lack energy. According to the analyst, what’s missing is conviction. No surge in volume. No decisive breakout candles. Just small, cautious moves higher that stall quickly. Without a clear spike in participation, any breakout attempt risks turning into another fake move.
Volume is the deciding factor here. Thin volume during repeated trendline tests often leads to whipsaws. Traders might see a close above resistance and assume momentum, only to watch it fade the next day. For now, Dogecoin sits in a technical waiting room. Support is intact, yes, but momentum hasn’t committed.
A Rare Long-Term Signal Emerges
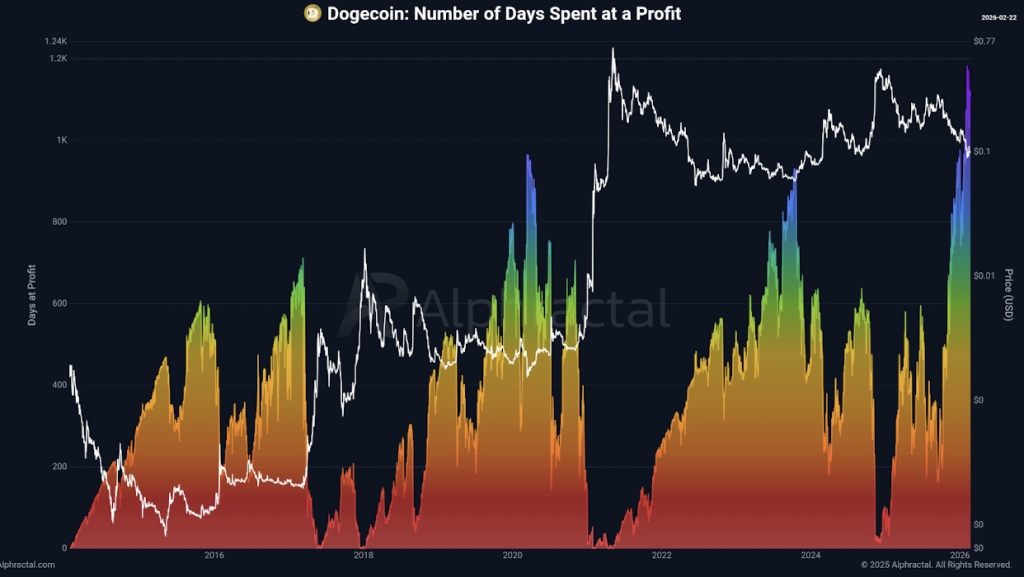
While short-term charts show hesitation, on-chain data is telling a deeper story. Analyst Joao Wedson highlighted that Dogecoin has now logged more than 1,100 historical trading days where price was higher than today’s level. That’s the highest reading ever for the asset.
The metric, called the Number of Days Spent at a Profit, tracks how many past days saw DOGE trading above its current price. In simple terms, it reflects how much historical “overhang” exists, how many holders are underwater compared to previous cycles.
More than 1,100 days of higher prices means a large share of long-term participants are currently sitting on losses. That kind of structural positioning often appears during late-stage downturns or early accumulation phases. It’s not a timing tool for day traders. It’s more of a cycle marker.
Two Angles, One Uncertain Outcome
So here’s the situation. On one side, a descending trendline continues to hold, but without explosive volume or strong buyer follow-through. On the other, a historic on-chain reading suggests Dogecoin is deeply discounted relative to much of its own trading history.
Neither signal guarantees a reversal. But together, they frame a market at an inflection point.
If volume arrives and price breaks resistance cleanly, the technical picture could shift quickly. If not, the structure risks softening further. For now, Dogecoin remains balanced between structural accumulation and short-term hesitation, and traders are watching closely to see which side blinks first.