- Solana’s active addresses and transaction volume have surged, supporting the recent rebound
- Price has broken out of a multi-month downtrend and reclaimed key support near $135.5
- Momentum, derivatives positioning, and liquidation data all lean cautiously bullish while support holds
Solana’s on-chain metrics have expanded sharply over the past week, pointing to renewed demand building beneath the recent price rebound. Active addresses jumped 56% week-over-week to roughly 27.1 million, while weekly transactions climbed to around 515 million. That scale matters. Sustained usage tends to show up before price strength, not after.
Activity alone doesn’t usually spark rallies, though. What makes this move different is timing. The growth in usage aligned closely with price stabilizing inside the $119.8 to $135.5 demand zone. That overlap gives the recovery some structure, rather than leaving it dependent on sentiment alone. It also hints that capital is rotating back into Solana’s ecosystem with intent, not just chasing short-term moves.
Still, this support needs consistency. If activity drops back below recent averages, conviction fades quickly. For now, usage metrics suggest buyers have regained control under price, but that edge has to be maintained.
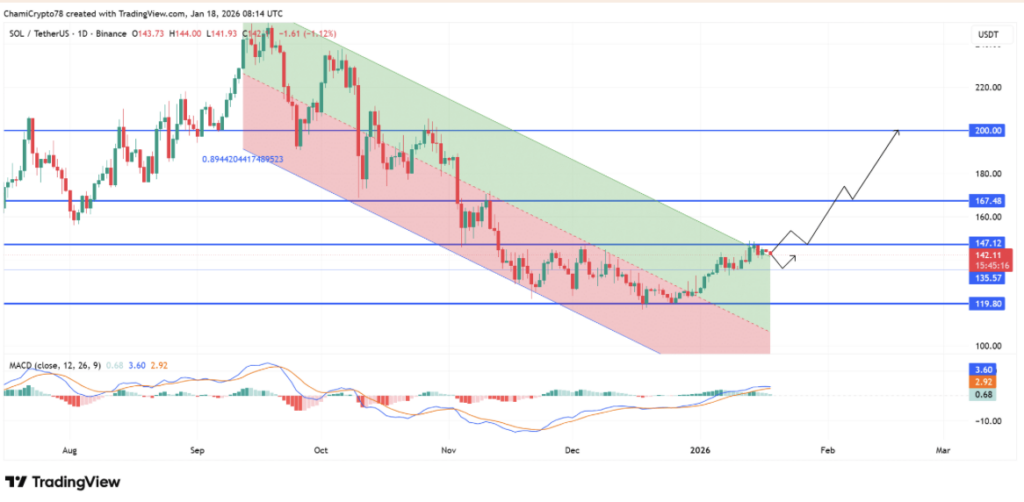
SOL Breaks Out of a Multi-Month Downtrend
Price action has started to confirm the shift. Solana broke free from its multi-month regression downtrend after buyers defended the $119.8 low and pushed price back above descending resistance. That move mattered, especially because it wasn’t immediately rejected.
The breakout reclaimed the $135.5 to $147.1 zone and flipped it into support. Previously, rallies kept failing below this area. This time, price held, trading near $142 and continuing to form higher lows. As long as $135.5 stays intact, the structure favors continuation rather than a return to the prior range.
That said, losing this zone would reopen downside risk toward $119.8. For now though, the chart supports a transition out of correction mode and into a recovery phase, even if upside still needs to be proven.
Momentum Starts to Catch Up With Structure
Momentum indicators are beginning to align with the improving structure. The MACD crossed higher from negative territory, with the MACD line rising above the signal line and the histogram flipping positive. That shift reflects fading sell pressure rather than an overextended move, which is usually a healthier setup.
Earlier bounces lacked this kind of confirmation and faded quickly. This time, the crossover came after support was reclaimed, not before. Expanding histogram bars suggest the trend force is strengthening, though that needs follow-through. If momentum flattens here, consolidation becomes more likely.
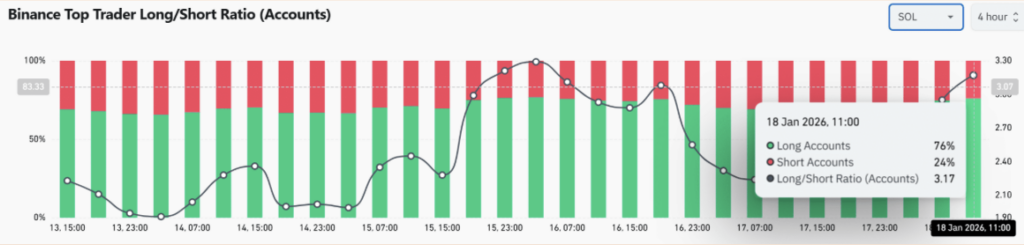
Traders Lean Long, but Without Excess
Derivatives data shows confidence rebuilding, but not in an overheated way. On Binance, top trader accounts are holding roughly 76% long exposure versus 24% shorts, pushing the long/short ratio to about 3.17. That’s elevated, but not extreme. Overcrowding usually starts showing up closer to 4.0 and above.
What stands out is positioning behavior. Long exposure increased after the technical breakout, not ahead of it. That alignment reduces the risk of immediate distribution. Still, leverage remains sensitive. A break below $135.5 could unwind longs quickly, so this level continues to carry weight.
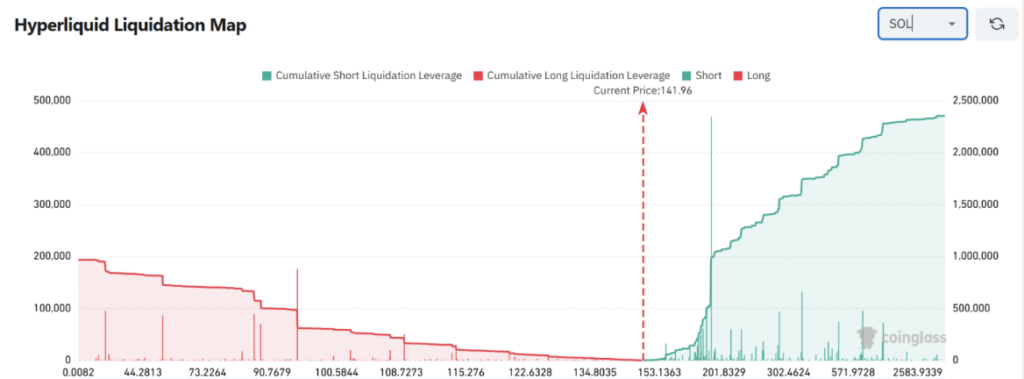
Liquidation Data Tilts the Risk Higher
Hyperliquid liquidation data adds another layer. There’s dense short-side liquidity stacked above current price, especially around $153, then higher near $201 and even into the $300+ region. Below $135, long liquidation clusters remain relatively thin.
That imbalance reduces downside cascade risk and creates a potential upside magnet. If price pushes higher, forced short liquidations could accelerate momentum. Of course, liquidity doesn’t move price on its own, it needs a trigger. But right now, structure and momentum are aligned with those incentives.
The Bigger Picture for SOL
Taken together, Solana’s rebound looks increasingly grounded in measurable demand rather than speculative enthusiasm. Rising network activity, a confirmed trendline breakout, improving MACD momentum, and long-leaning but controlled derivatives positioning all point in the same direction.
As long as SOL holds above the $135.5 support zone, overhead short liquidity remains a valid upside driver. If that level fails, momentum likely stalls and price consolidates before attempting another move.
For now, the edge belongs to the bulls, but it’s conditional.