- Sui recently spiked 10% but gave back most of the move, slipping below the $2.07 pivot and cutting weekly gains to around +0.45%, with a fresh -3.36% daily drop.
- Indicators show mixed signals: RSI near 42.07 and a positive MACD histogram, but the MACD line still below the signal, while a close under $2.00 could drag SUI toward the $1.85–$2.00 support range.
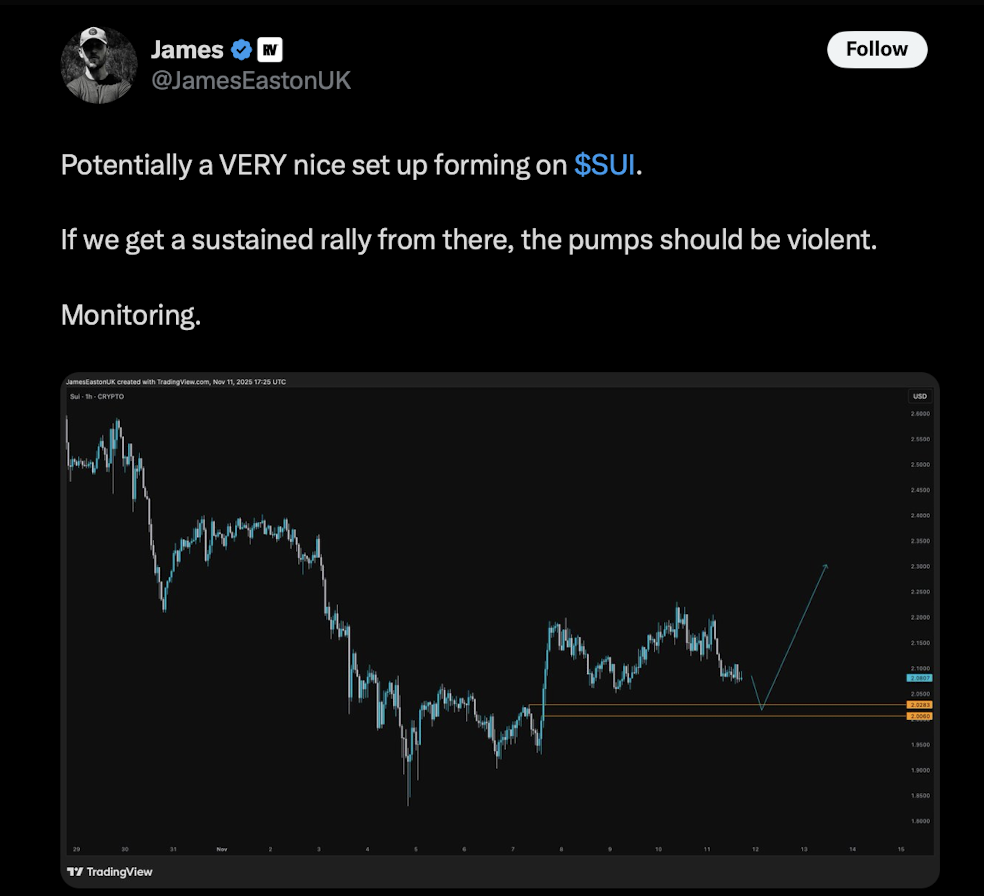
- If $2.00 holds, bulls may drive price toward $2.16 and $2.37 over the next 5–7 trading days, with analysts calling the current zone a “very nice setup” for a potential strong move.
Sui’s price action has been a bit of a rollercoaster, and right now it’s sitting at one of those make-or-break zones traders love and hate at the same time.
Sui cools off after surprise 10% pump
Last week, Sui (SUI) exploded upward with a fast 10% move, catching a lot of traders off guard with how quickly it ran. That kind of sudden spike almost always attracts profit-taking, and this time was no different. As sellers started locking in gains and the chart broke down technically, SUI slipped back under the key $2.07 pivot level. Now that the dust has settled a bit, that strong weekly gain has basically been chopped down to around +0.45%, while the last 24 hours show a -3.36% drop, leaving price hovering awkwardly around the $2.00 area.
Alongside the price retrace, Sui’s market cap has shrunk by roughly 3.52% to about $7.49 billion. That pullback in valuation hints that confidence cooled off quickly after the technical breakdown. Even so, a lot of crypto analysts are still watching SUI closely. The current zone looks like it could be the early stage of a bigger setup — if, and this is a big if, the $2.00 region holds as support and buyers step back in with some energy.
Key levels and indicators on the Sui chart
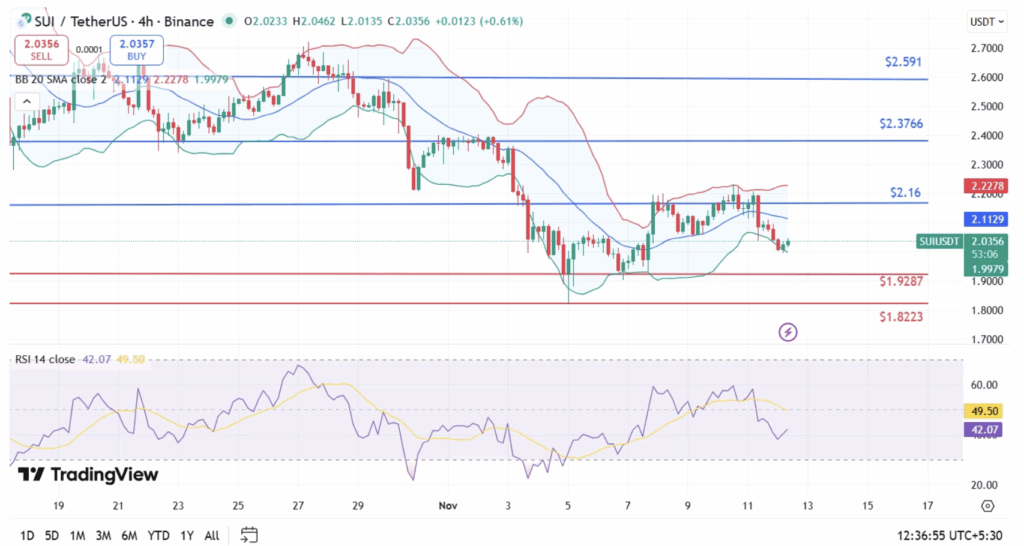
Looking at the Sui price chart, a few things jump out right away. SUI has slid below both its $2.07 pivot and the 7-day simple moving average (SMA) around $2.08, which clearly shows that bulls lost control of the short-term structure. From a trend perspective, that’s a warning sign. On the momentum side, the RSI-14 is sitting near 42.07, which suggests that SUI has been recovering from slightly oversold conditions but hasn’t flipped back into strong bullish territory yet. It’s like it’s trying to stand back up after getting knocked down, but still a bit shaky.
Interestingly, the MACD histogram has turned positive with a reading near +0.011, signaling that bearish pressure has eased a bit under the surface. However, the MACD line is still running below the signal line, which means overall momentum still favors the bears for now. As long as that crossover hasn’t fully flipped, sellers technically have the upper hand. The real danger line is very simple: a clean daily close below $2.00 could invite aggressive selling, dragging SUI toward its Fibonacci retracement support area in the $1.85–$2.00 range.
What happens if $2.00 holds — or breaks
On the current 12-11-25 snapshot of price, that $1.85–$2.00 support band looks like the battlefield. If this zone holds up, there’s a solid chance we see SUI stabilize and start forming a base, with potential upside into next week. From that region, any convincing bounce could give the bulls room to launch a fairly sharp recovery move. The first obvious target on the upside would sit around $2.16, followed by a push toward roughly $2.37, which lines up as an intraday resistance zone.
In terms of timing, those levels — $2.16 and $2.37 — are realistic objectives over the next 5–7 trading days, assuming SUI defends the $2.00 mark and sentiment doesn’t completely fall apart. In a more bearish scenario, if price loses that $2.00 floor with a strong candle close, the downside could accelerate quickly, making $1.85 the next major line in the sand. On the flip side, if buyers jump in aggressively while the RSI dips deeper toward oversold, the bounce could be quite sharp, almost snap-like, with price possibly rushing back into that $2.16, then $2.37 resistance stack in a short window.
Analysts eye a “very nice setup” on SUI
Some analysts seem to like what they’re seeing here, even with the recent pullback. Analyst James, for example, echoed this view in a recent post on X, calling the current structure a “very nice setup.” His view is that if SUI can sustain a rally off these support levels, the follow-through could be intense, with big percentage swings on the table once momentum returns.
So right now, Sui is in that classic crypto limbo: price is parked near a key round number, momentum is tilted but not fully decided, and sentiment is cautious but still curious. If $2.00 holds and bulls push back, we might look back at this zone as the launchpad for the next big leg up. If it cracks, though, the market may need to reset lower before any serious trend can resume.