- HBAR’s stuck between $0.152 and $0.160 with fading momentum and weak volume.
- A breakout above the 20-day SMA could spark a push to $0.17+, but downside risk to $0.148 remains.
- Indicators show buyers aren’t gone—but they’re definitely not confident yet.
Hedera (HBAR) might be trying to shake off its slump, but it’s not exactly sprinting. After weeks of choppy moves and downward pressure, the token’s found itself wobbling just above $0.154 as of July 6, 2025. It’s trying to poke at that $0.160 ceiling again—but so far, that resistance isn’t budging.
Traders? They’re still on the fence. You can feel it in the market data—volume’s light, indicators are neutral, and open interest isn’t doing anything loud. Basically: cautious vibes all around.
Volume Fades, Bounce Fizzles
Yesterday started with a bit of a flicker—HBAR crawled up from $0.152 to touch just over $0.155. Some thought, “Maybe it’s waking up?” But nope. That bounce couldn’t hold. It stalled at $0.1555 and limped back down by day’s end, closing just a tick above $0.153. So much for momentum.
And the volume? Pretty soft. It slid to $119M, down from $162M the day before. That drop kind of says it all—traders are just… not piling in right now. Without fuel (aka volume), this little rally didn’t stand much of a chance.
HBAR’s still holding a $6.49B market cap, ranked #27, but without a fresh wave of buyers, the upside’s probably capped short-term.
Price Action: Flat and Cautious
Zoom in to the 1-hour chart and things get… quieter. HBAR’s bouncing inside a tight box, $0.152 to $0.156, following that late June run from under $0.145 to just shy of $0.164. But now? That excitement’s faded. It’s moving sideways. Just… hanging out.
This rangey behavior says bulls and bears are kind of at a standstill. If the price can climb back above $0.156 and actually stay there, we might get a shift in mood. Until then, sideways it is.
Open interest tells the same story. It spiked to 3.8M contracts during the rally, but now it’s dipped to around 3.399M. That’s traders cashing out or stepping back—not exactly bullish firepower. If OI keeps dipping and HBAR loses $0.152, things could slide toward $0.148 or even worse.
Recovery Looks… Wobbly
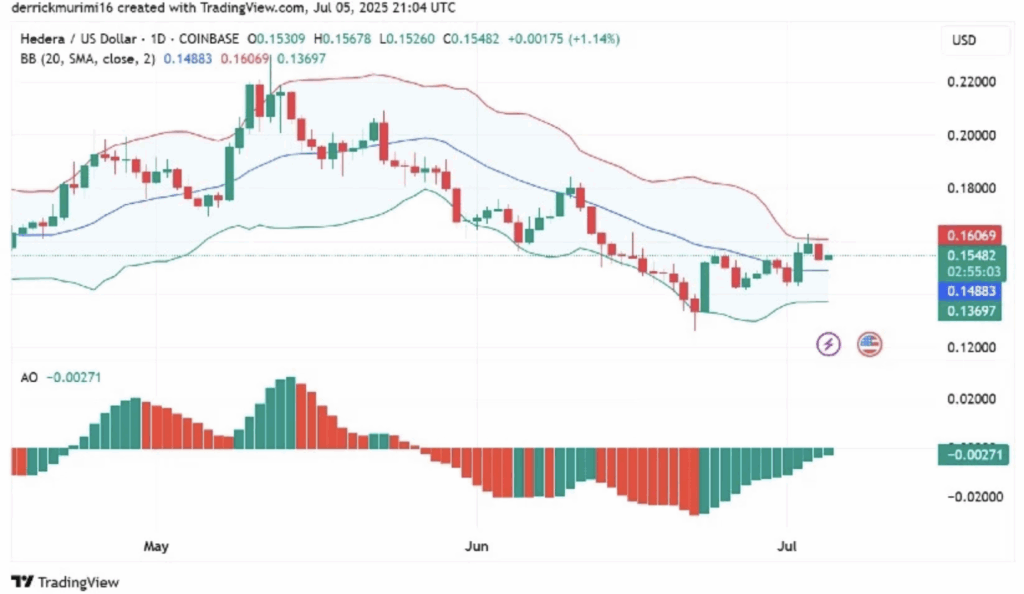
Technically speaking, HBAR closed at $0.15482, a 1.14% gain—not bad, not great. The candle nudged close to the top of the Bollinger Band, but the 20-day SMA at $0.16069 is still acting like a brick wall. Break it, and there’s room to stretch toward $0.17–$0.18. Fail? Then the price could get shoved down toward $0.148 or even $0.13697, near the lower Bollinger edge.
The Awesome Oscillator (AO) flashed a tiny bit of green, which is something… but it’s still under zero at -0.00271. That means bearish momentum’s cooling, yeah—but bulls aren’t in the driver’s seat yet.
For HBAR to look actually strong, we’d need AO to pop above zero and volume to rise alongside price. Until then, this whole thing’s a bit of a coin toss—low momentum, low conviction, and a price stuck in limbo.