- Shiba Inu (SHIB) dropped 10.2% over the weekend, pulling back from $0.0000152 to $0.0000136 as Bitcoin’s momentum stalled — but a potential double-bottom pattern hints at a bullish reversal.
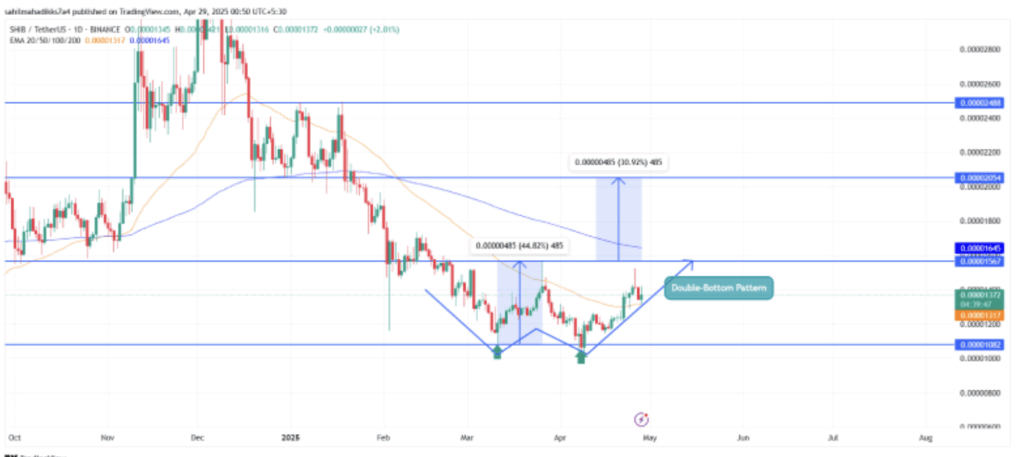
- If SHIB breaks above the $0.00001675 neckline, it could rally up to $0.0000177 or even $0.00002, with the 20 and 50 EMAs offering short-term support and RSI showing growing buyer momentum.
- However, resistance at $0.00001645 remains a key hurdle — failure to break through may result in sideways movement in the short term.
This past weekend, the crypto market hit a bit of a speed bump. Bitcoin stalled near the $95,000 mark, and that hesitation bled into the altcoin scene — especially hitting the more volatile memecoins. Among them, Shiba Inu (SHIB) took a noticeable dip, sliding 10.2% in just 72 hours, pulling back from resistance at $0.0000152 to about $0.0000136. So… is this just a pause? Or are buyers prepping for a counter move?
A Double Bottom Pattern — Bullish Clues?
Looking closer, the charts are showing something interesting. After bouncing from the $0.00001053 floor, SHIB managed to push its way up to $0.00001358, a 29% gain from the bottom. That’s not small. Even better — it punched through a key resistance at $0.0000128 and reclaimed the 20 and 50 EMAs, which signals a shift in short-term sentiment.
But the real highlight? A classic double-bottom pattern is forming. This “W-shaped” setup typically hints at reversal potential, meaning buyers might finally be stepping in for real.
At the time of writing, SHIB is hovering around $0.00001358, up 1.7% intraday, with its market cap ticking up to $8.03 billion (CoinGecko data). Not bad for a meme project.
What Happens If SHIB Breaks Out?
If this pattern holds up, SHIB could be setting up for a 16% rally toward the $0.00001675 neckline. And if it manages to break through that resistance cleanly, the next targets on deck are $0.0000177, then possibly even $0.00002.
That would mark a pretty strong turnaround and could be the start of a real bullish wave — especially if broader market sentiment improves.
Here’s the flip side, though: if $0.00001645 keeps rejecting price action and sellers dig in, SHIB might just end up stuck in a sideways grind for a while longer.
Technical Snapshot
- EMAs: The 20- and 50-day exponential moving averages were recently reclaimed, giving SHIB some short-term dynamic support. But — and it’s a big but — the coin’s still trading under the 100 and 200 EMAs, so the bigger trend still leans bearish.
- RSI: The Relative Strength Index is showing a higher low, which usually means building momentum. Basically, it’s saying that buyers are showing up sooner — a good sign for a bullish reversal, assuming the pressure keeps rising.
Final Take
SHIB might be teasing a breakout, but we’re not there just yet. The double-bottom formation and reclaim of key EMAs are promising signs, and if the price breaks past that $0.00001675 zone, we could see a strong leg higher. But if the sellers keep shutting the door — expect more sideways chop.
Still, for now, it looks like bulls have a shot, and the next few days will likely reveal whether this is a real breakout or just another fake-out.