Ethereum (ETH) rallied briefly on Wednesday, and a market-wide uptick in crypto prices indicates that bulls are focused on starting November in the green.
On November 2, the U.S. Federal Reserve announced a three-quarter basis point increase in interest rates. At first, the announcement positively impacted cryptocurrency and stock markets, which recorded slight gains just before Fed Chairman Jerome Powell’s speech about the rate hike and the future of Fed policy.
ETH briefly climbed to a daily high at $1,622 before correcting to close the day at $1,518. While Ether’s price has been dropping since the weekend, holding above the crucial $1,500 psychological level is essential for ETH.
The 75 basis point interest hike was already priced in by investors, and Powell, together with the Federal Open Market Committee (FOMC), indicated that the rate hikes would continue. Powell also hinted at a potential pivot based on the data to be analyzed in the next meeting.
Such a scenario indicates that Bitcoin, Ether, and other digital currencies will remain closely correlated to U.S. equities and display similar price volatilities witnessed before and after different rate hike cycles in the past. Ethereum bulls are already preparing for post-FOMC gains and price jump with the appearance of a bullish flag on the daily chart.
Technical Formation To Push Ethereum Price To $2000
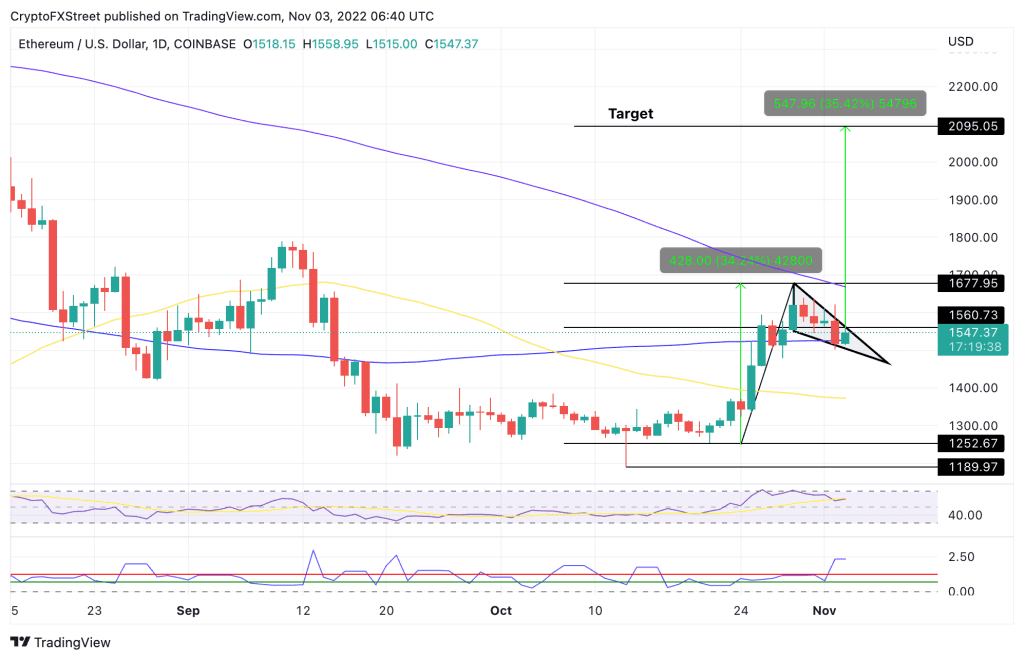
ETH’s price action led to the appearance of a bullish flag on the daily chart. This is a significantly bullish technical pattern, usually signaling the continuation of an uptrend. It is often formed following a sharp increase followed by a moderate correction that triggers buyers to get in at lower levels. What follows are massive buy orders that take the price above the technical formation.
In Ether’s case, a daily candlestick close above the flag’s resistance line at $1,560 could trigger intense buying that could see the token of the world’s second-largest crypto by market cap rise first towards $1,677 and later to the $1,800 psychological level.
In highly ambitious cases, bulls would push the price to close the liquidity zone defined by the $1,800 and $2,000 range to reach the target of the governing chart pattern at $2,095. This would represent a 35.42% climb from the current levels.

Apart from the technical chart pattern, the up-facing 50-day Simple Moving Average (SMA) and the upward movement of the Relative Strength Index (RSI) added credence to ETH’s optimistic outlook. The price strength at 60 suggested that the buyers had taken over control of Ethereum’s price.
On the other hand, the Arms Index (TRIN) just sent a bearish signal when it rose above the red line at 1.26. This indicated that more sellers were in the market and selling on the minor rally to $1,600.
If these sellers can pull the price below the $1,560 level, Ethereum could remain inside the flag for a few days. Increased supply would then push the token of the smart contracts below the support line of the bullish pennant at $1,500, confirming a drop below the pattern.
In such a scenario, the ETH price may drop towards the 50-SMA at $1,370 after losing the support from the $1,400 psychological level. In highly bearish cases, the altcoin may drop toward the $1,250 support flow or the $1,190 swing low.


