
- SUI is stabilizing near the $1.38–$1.40 demand zone, with buyers repeatedly stepping in after liquidity sweeps.
- Analysts suggest a break above $1.44–$1.46 could trigger a relief rally, while losing $1.38 may invite further downside.
- Despite short-term stability, weekly indicators remain bearish, signaling that broader momentum has yet to recover.
SUI is starting to look a little more composed after a choppy stretch, with buyers continuing to defend an important zone on the chart. Price action feels less frantic now, almost like the market is catching its breath. Selling pressure hasn’t disappeared, but it does seem to be easing, which keeps the short-term outlook steady for the moment.
At the time of writing, SUI is trading near $1.37, with around $710 million in 24-hour volume and a market cap sitting close to $5.25 billion. The token is down roughly 1.5% on the day, a mild pullback that hints at balance rather than panic. Buyers and sellers appear to be testing each other, without either side fully committing yet.
Buyers Defend a Key Demand Zone
Crypto analyst BitGuru pointed out that SUI is hovering in a critical demand area between $1.38 and $1.40. Price briefly dipped below this zone, sweeping liquidity, but that move was quickly met with buying. The fast response suggests there are still players willing to step in at these levels, quietly absorbing supply.
According to BitGuru, the next real test comes higher up. If SUI can push through and hold the $1.44–$1.46 range, a relief rally toward upper supply zones becomes more realistic. On the flip side, losing the $1.38 area could invite another wave of selling, especially if broader market sentiment turns risk-off again.
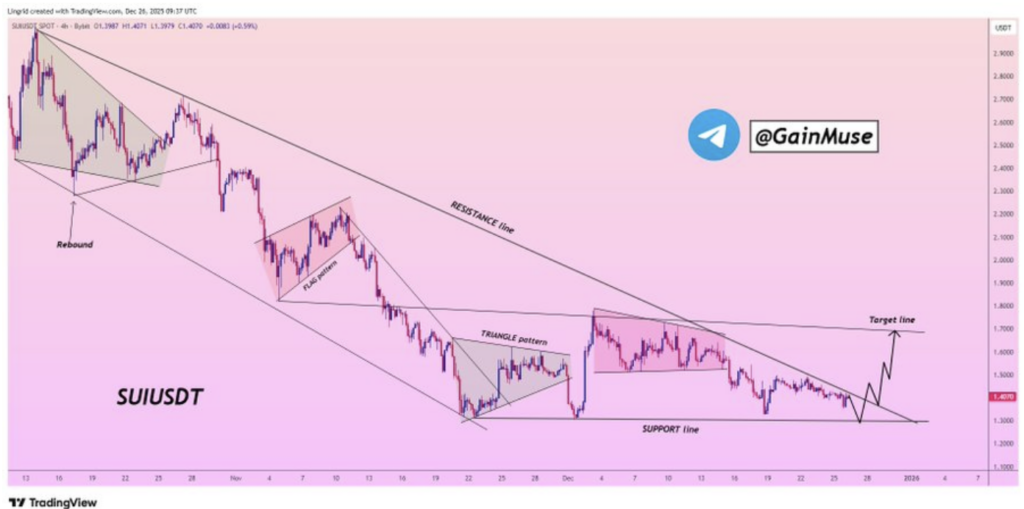
Compression Signals a Possible Reversal
Another analyst, GainMuse, sees something more structural forming beneath the surface. The tight price compression around support levels often shows up when accumulation is taking place, particularly if buyers keep showing up consistently rather than all at once. It’s not flashy, but it’s how reversals often begin.
From this angle, SUI looks like it’s entering a decision phase. Either buyers manage to grind price back toward nearby resistance, or the market fails to hold its footing and slips lower. The next move probably won’t be subtle.
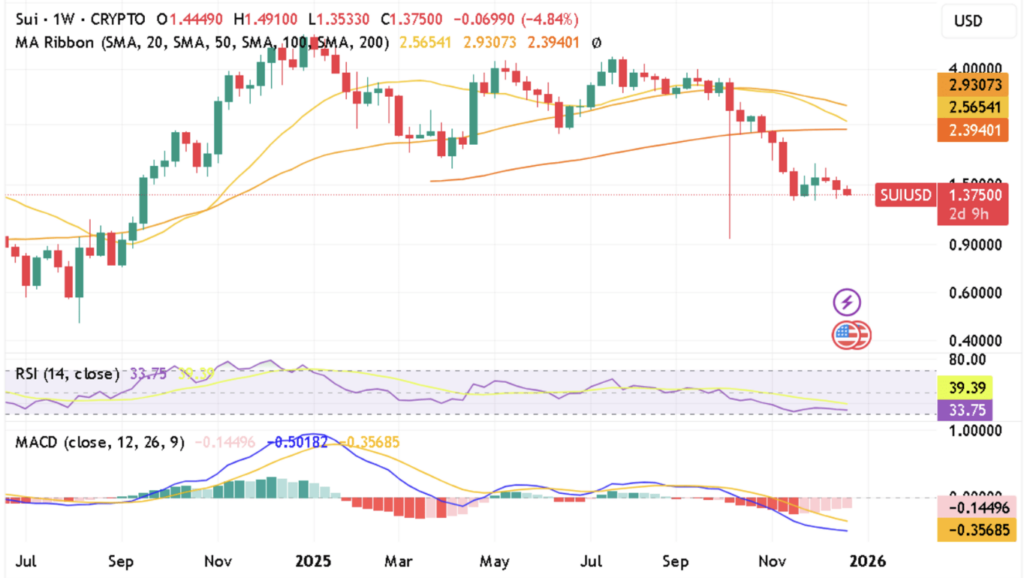
Weekly Momentum Still Tells a Cautious Story
Zooming out, the weekly indicators remain under pressure. The RSI sits around 33.7, well below the neutral 50 mark, which reflects weak momentum and lingering selling interest. The RSI signal line is also trending lower, suggesting bears haven’t fully stepped aside yet.
Price is still trading far below its major moving averages, with the 20-week, 50-week, and 200-week levels clustered much higher. That gap underscores how much ground SUI would need to recover to shift the broader trend. The MACD reinforces this view, staying deep in negative territory with red histogram bars still printing on the weekly chart.
For now, SUI’s short-term stability is encouraging, but the bigger picture remains cautious. Until momentum indicators start to turn and price reclaims higher levels, bearish pressure hasn’t truly gone away. The coming sessions should reveal whether this calm is the start of something stronger, or just another pause before the next move.