
- SUI is trading near $0.89 while consolidating inside a narrow support range.
- Analysts warn that a break below $0.85 could push the price toward $0.60 support.
- Momentum indicators show early signs that selling pressure may be easing.
SUI has entered a fairly tight trading range lately, and traders are watching closely to see whether the recent correction is finally starting to cool off. The token is still facing some short-term pressure, sure, but a few technical signals suggest the market might be attempting to stabilize around a key support zone.
At the moment, SUI is trading near $0.8948 with a daily trading volume hovering around $344 million. Its total market capitalization sits close to $3.48 billion. Over the past 24 hours the price has slipped about 1.25%, which isn’t dramatic by crypto standards, though it does reflect the cautious tone that’s settled across the altcoin market lately.
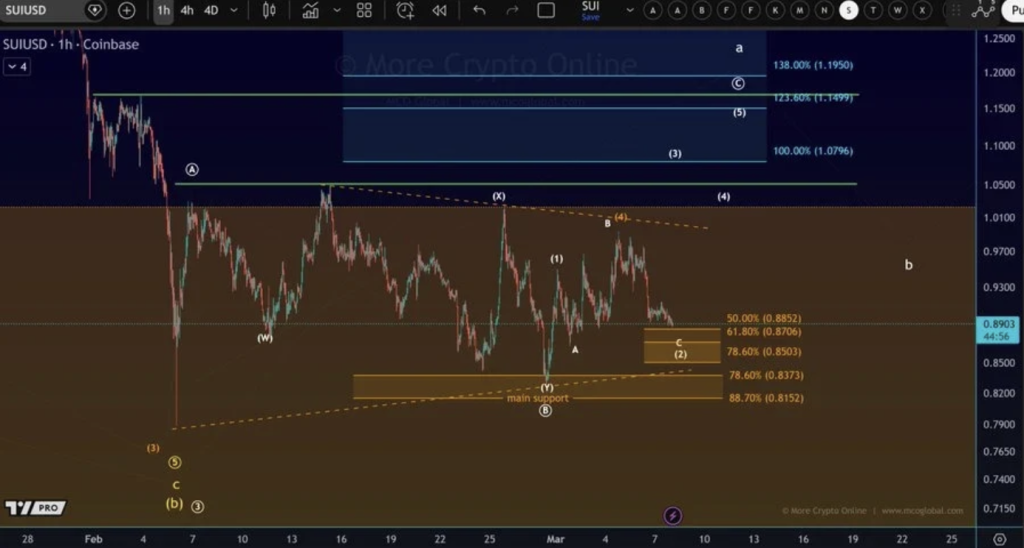
Analysts Suggest SUI Could Still Be in Wave Two
On March 8, crypto analyst More Crypto Online shared an update suggesting that SUI might still be moving through what Elliott Wave traders call wave two of a larger structure. In simple terms, that would mean the asset is still working through a correction phase before potentially starting a new upward leg later.
According to the analysis, SUI is currently rotating inside a broader sideways range where several price zones act as support. The most important support area appears to sit between $0.815 and $0.837. Beneath that level, buyers previously stepped in during earlier pullbacks.
Closer to the current price, there’s another smaller support zone around $0.85 to $0.899. Interestingly, the market has been hovering right near the upper edge of that band recently, which makes the coming sessions pretty important.
Support Zone Could Decide the Next Move
For the bullish structure to remain intact, the market likely needs to stabilize inside this support range over the next few days. If buyers manage to defend the zone and price holds steady above it, the broader structure could remain constructive — potentially setting the stage for the next upward move.
If that stability fails to appear, however, the situation could change rather quickly. According to the analysis, the market may still be developing what’s referred to as circle wave B within the larger correction. In other words, the pullback might not be finished yet.
A clean break below the $0.85 level would be a warning sign. If selling pressure pushes the price through that floor, the next meaningful support could sit much lower, closer to the $0.60 region.
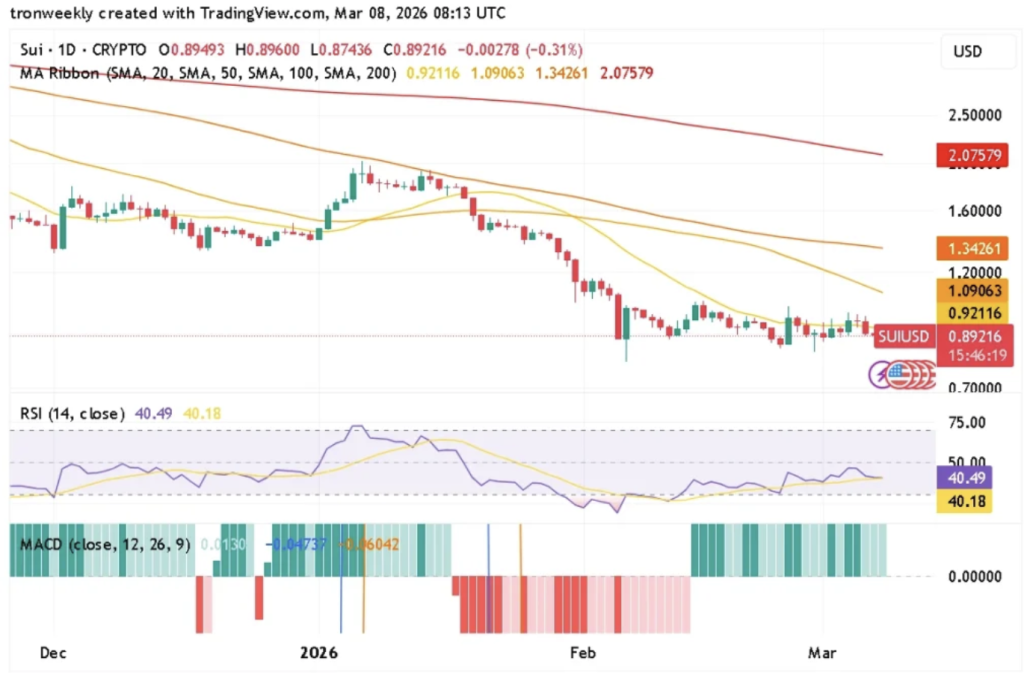
Indicators Show Weak but Improving Momentum
Technical indicators paint a slightly mixed picture right now. While the price has begun to stabilize somewhat, SUI is still trading below several key moving averages — including levels around $0.921, $1.090, $1.342, and $2.075. That positioning suggests the broader trend hasn’t fully shifted back to bullish yet.
Momentum indicators, though, are starting to show small improvements.
The Relative Strength Index currently sits near 40.49, with the signal line around 40.18. That reading remains below the neutral midpoint of 50, which typically indicates weaker momentum, but it does show the market gradually trying to recover from deeper bearish conditions.
Meanwhile, the MACD indicator has started to turn slightly more positive. The histogram has flipped into green territory after several negative sessions, hinting that selling pressure may be slowing down — even if it hasn’t disappeared completely.
For now, SUI remains at a bit of a crossroads. Buyers appear to be testing the waters again, but stronger demand will likely be needed before the market can establish a clear uptrend.