- Solana ETFs have recorded eight straight weeks of inflows, reinforcing institutional demand
- Derivatives data shows rising Open Interest and heavier short liquidations
- Technical indicators point to improving momentum, with $145 and $150 as key levels to watch
Solana started the week on a firm footing. SOL edged about 2% higher on Monday, extending Sunday’s nearly 3% gain, and the move didn’t feel random. A steady stream of capital into US spot Solana ETFs continues to signal deeper institutional interest, while new developments on the network itself are starting to catch attention.
At the same time, Solana is testing ideas around private transactions through a newly launched hackathon. That combination, institutional demand on one side and feature expansion on the other, is quietly reshaping sentiment around SOL.
ETF Inflows and Privacy Experiments Gain Attention
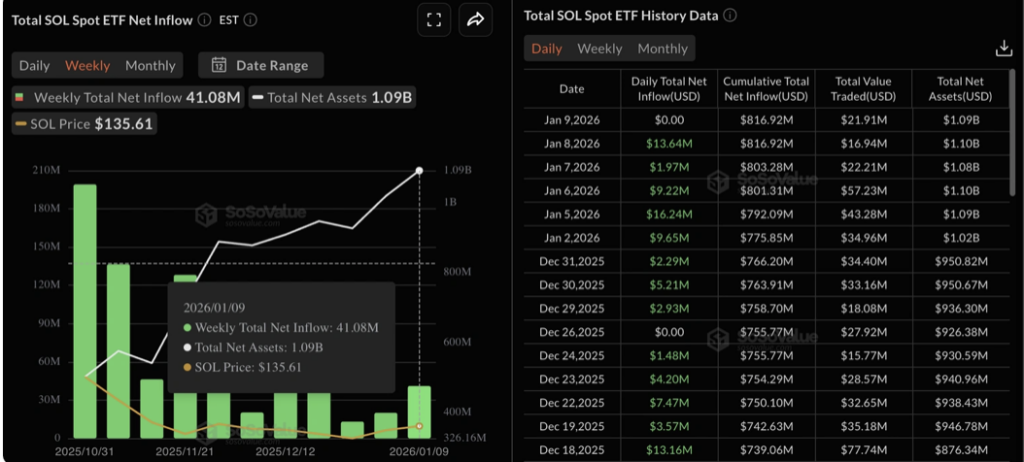
Solana-focused ETFs pulled in roughly $41.08 million in inflows last week, marking their eighth straight week in the green. That consistency suggests institutions aren’t just dabbling, they’re sticking around. As this demand builds, Solana is also exploring privacy tools that could eventually place it closer to networks like Zcash or Monero in certain use cases.
The Privacy Hack, which kicked off on Monday, is offering $75,000 in rewards across multiple tracks. These include private payment solutions, a launchpad, and an open category for other privacy-focused ideas. Submissions are open until February 1, with winners set to be announced on February 10. It’s an experiment for now, but one that could expand Solana’s appeal beyond speed and cost efficiency.
Derivatives Data Shows Bulls Gaining Ground
On the derivatives side, traders appear to be leaning more bullish. CoinGlass data shows Solana futures Open Interest climbing 4.90% over the past 24 hours, reaching about $8.58 billion. That rise suggests fresh capital is entering the market, not just repositioning.
The 24-hour long-to-short ratio sits near 1.02, indicating slightly more long positions than shorts. Liquidation data backs this up. Short liquidations totaled around $12.61 million, significantly higher than the $2.14 million in long liquidations. In simple terms, bearish bets are getting squeezed more often than bullish ones.
Technical Structure Turns Constructive
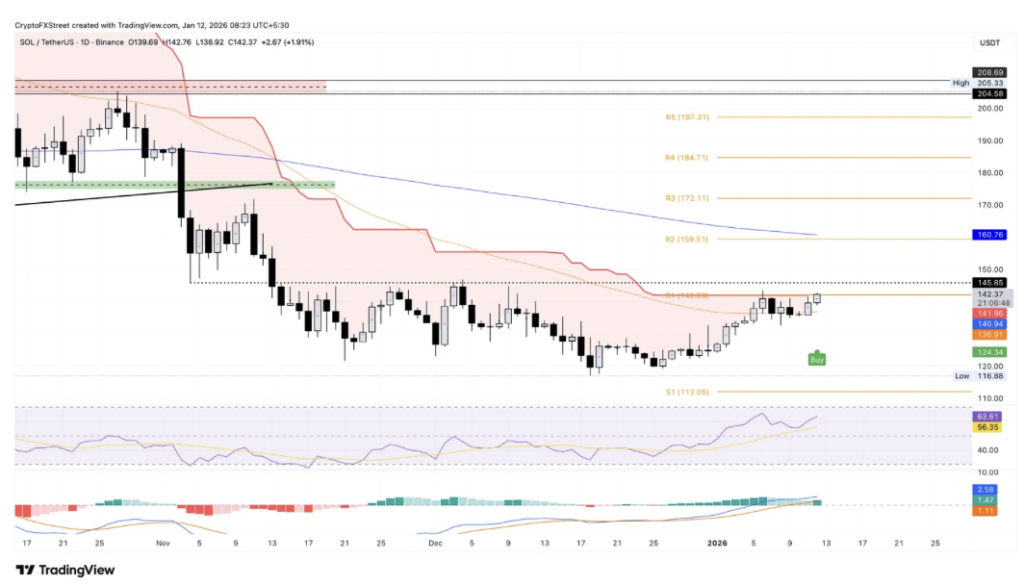
From a chart perspective, Solana is starting to look healthier. Price has pushed above the 50-day EMA near $136 and is now trading above the R1 pivot level around $142. At press time, SOL was inching closer to the $150 region, a level many traders are watching closely.
Solana also crossed above the Supertrend indicator, flipping it into a buy signal and confirming a fresh uptrend. Still, one hurdle remains. The November 4 low near $145 has capped upside attempts since mid-November. A daily close above that level would strengthen the recovery narrative and open the path toward $150, followed by the R2 pivot near $159.
Momentum indicators support the bullish case, at least for now. RSI is hovering around 63, moving back toward overbought territory after a brief pullback last week. MACD has also turned supportive, with green histogram bars expanding above the zero line, pointing to building bullish momentum.
Of course, risk hasn’t disappeared. If Solana fails near $146 and reverses lower, a break below the 50-day EMA could expose the December 18 low around $116. That’s the downside traders will want to keep in mind as price pushes higher.