- Solana has fallen back into the $100–$105 support zone after a sharp sell-off, placing price at a critical inflection point.
- Short-term structure remains weak, with recovery requiring a reclaim of $110–$115 to shift momentum.
- Weekly support and resilient ETF inflows suggest this zone could define Solana’s next major move.
Solana price is back under pressure after a sharp sell-off pushed the token into a critical $100–$105 support zone. Traders are watching this area closely, trying to figure out whether the recent move marks exhaustion, or just another pause before more downside. It’s one of those moments where the next few candles matter more than the last few weeks.
At the time of writing, SOL is trading near $104, following a steep short-term drop amid broader weakness across the crypto market. According to data from Brave New Coin, Solana is down more than 11% on the day, bringing price back to levels that have repeatedly shaped trend direction since early 2024. This zone has history, and the market knows it.
Solana Price Slides Into a Familiar Support Zone
The latest decline has dragged SOL back into the $100–$105 range, an area that has acted as a reaction zone multiple times over the past year. The move followed a clear rejection from the $140–$145 resistance band, where upside momentum stalled earlier in January. Once that level failed, sellers took control quickly.
The speed of the decline, combined with shifting volume behavior, suggests the market may be entering a decision phase. Historically, Solana has tended to react strongly after extended moves into higher-timeframe support. Sometimes it bounces hard. Other times, it doesn’t. That uncertainty is what makes this zone so technically important.
Short-Term Structure Shows Cracks
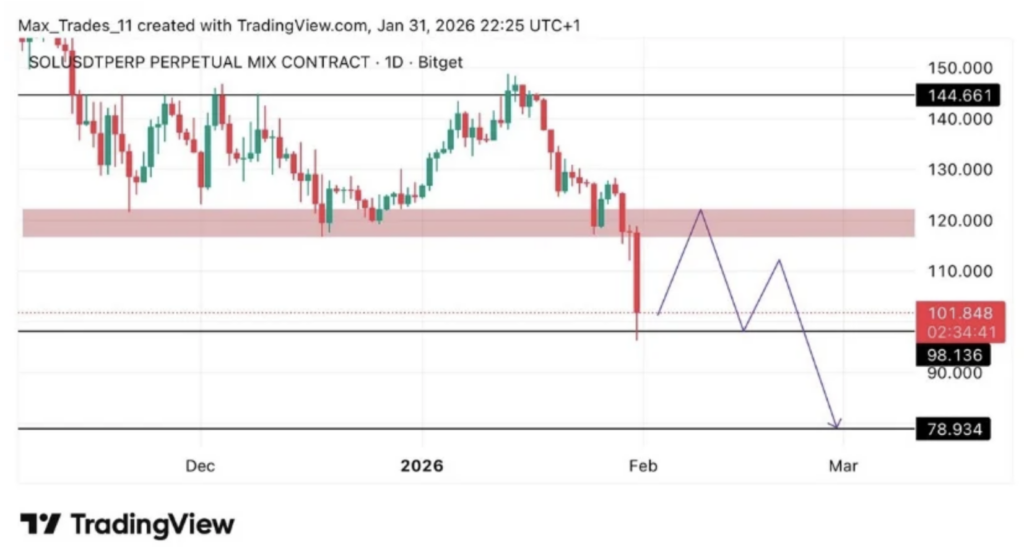
From a lower-timeframe perspective, analyst Max Trades points to a weakening structure after SOL lost the $120 support region. His chart outlines a possible corrective bounce toward $110–$115, but only if buyers show real follow-through. Without that, any bounce risks fading quickly.
If downside pressure continues, the next levels to watch sit near $98, followed by a deeper support band around $90–$92. A sustained break below those levels would confirm that bearish control remains intact. On the flip side, reclaiming $115 with strong volume would be needed to shift short-term bias back in favor of the bulls. Anything less probably isn’t enough.
Weekly Chart Signals a Pivotal Moment
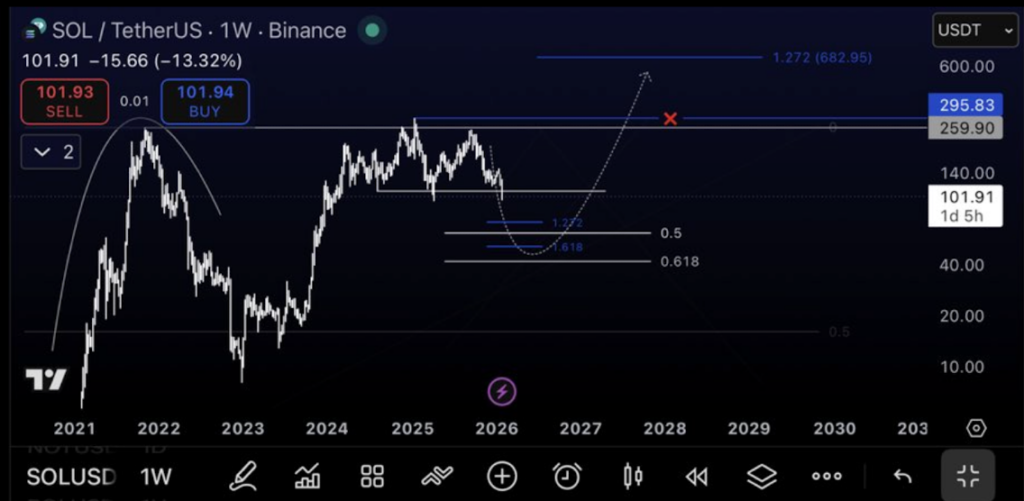
Zooming out, the weekly chart adds another layer of tension. Analyst Mshary_Charts highlights a long-term Fibonacci support cluster between $95 and $100, a zone that aligns with prior consolidation from earlier cycles. In the past, this area has acted as a launchpad for multi-month recoveries.
That said, failure to hold this region would open the door to lower structural support near $80–$85. Until a clear weekly close forms, Solana remains in a technically sensitive spot. It’s not broken yet, but it’s definitely being tested.
Institutional Demand Still Lingers
Beyond pure price action, institutional positioning adds an interesting wrinkle. Data shared by Crypto Chiefs shows that Solana spot ETFs have seen limited outflows, with cumulative net inflows still holding positive. That’s notable, especially given the broader market weakness.
These flows have remained relatively steady even as price slipped. Historically, assets that maintain institutional interest during drawdowns often re-emerge as leaders once sentiment turns. If liquidity conditions improve and risk appetite returns, Solana could benefit disproportionately, especially on the ETF side.
Final Thoughts: Where Does Solana Go From Here?
Solana is now sitting at a clear inflection point. Holding the $95–$100 region could stabilize the structure and prevent a deeper slide. Losing it would shift focus toward $80–$85, where the next major support sits. Only in a scenario where broader market conditions deteriorate sharply would much lower levels, like $50, come into play.
For now, the outcome depends on confirmation, not anticipation. Weekly closes, volume behavior, and broader market stabilization will decide whether this zone marks exhaustion or simply the final leg lower. The chart is quiet, but the implications aren’t.