- Solana jumped 8.53% to $84.73, but it remains down roughly 31% in 2026 despite strong trading volume and market share.
- On-chain fundamentals look stronger than price action, with DeFi TVL hitting a new high and stablecoin inflows driving capital into the network.
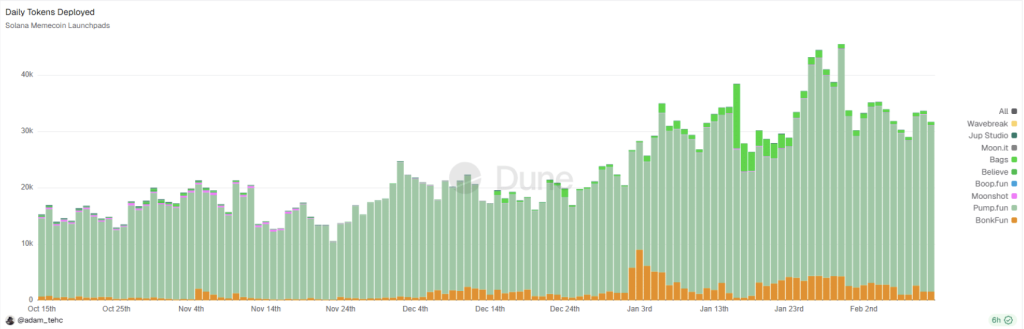
- Memecoin activity surged with 30,000 daily launches and $100M daily volume, boosting network usage but complicating SOL’s valuation narrative.
Solana caught a strong bounce on February 14, climbing 8.53% to trade around $84.73. Volume came in hot too, with roughly $6.32 billion changing hands in a single day, while SOL’s market cap sat near $48.12 billion, or about 2.01% of the broader crypto market. On the surface, it looked like a clean relief rally… but the bigger picture still feels a little messy.
SOL Price Is Bouncing, But 2026 Has Been Rough
Even with the latest pump, Solana is still down around 31% since the start of 2026. That’s a pretty ugly stat for a top-tier coin, especially when a lot of major names have held up better this year. So yes, SOL is moving again, but it’s moving from a weaker starting point than most people want to admit.
What makes this interesting is that the on-chain side isn’t matching the bearish price story. Solana’s DeFi total value locked (TVL) has pushed into a fresh all-time high around $80 million, largely fueled by stablecoin inflows. In plain English: even while price is sliding, more capital is being parked inside the network, and that usually doesn’t happen if confidence is totally dead.
Real-world asset (RWA) projects on Solana also reached new highs, adding another layer to the “fundamentals are fine” narrative. High liquidity plus rising TVL tends to mean investors are still deploying capital, not running for the exits. So the network is acting strong… while the chart is acting weak. That divergence is where the story gets spicy.
Technical Patterns Hint at Accumulation, Not a Clean Reversal
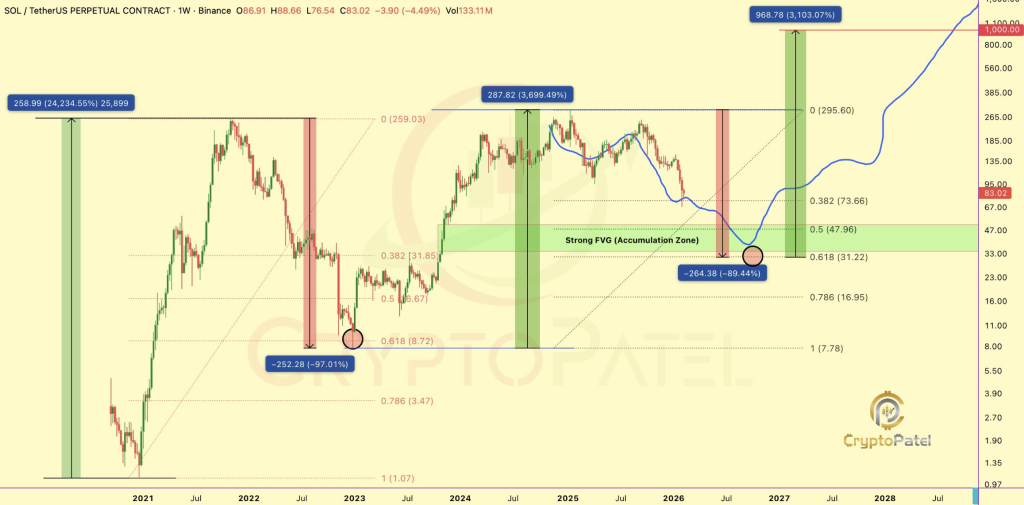
Some analysts are now leaning on historical fractals, basically comparing Solana’s current cycle to its older boom-and-bust patterns. In Cycle 1 (2020–2021), SOL went absolutely nuclear, ripping from $1.07 to $260, a gain of more than 24,000%. Then it collapsed 97% to around $7.78, which was brutal but also very “crypto.”
Cycle 2 (2022–2025) was another monster run, with SOL rallying about 3,700% from $7.78 to $295. And now, after topping out, the token is down roughly 77% from that peak, which puts it in familiar territory from a historical standpoint. It’s not pretty, but it’s not unprecedented either.
Crypto analyst CryptoPatel has suggested that if the pattern continues, SOL could drift down toward the 0.5–0.618 Fibonacci retracement levels. That would place a potential accumulation zone somewhere between $30 and $50, which… would definitely shake the room. Long-term targets, if history repeats, are being floated in the $500 to $1,000 range, but those are not predictions, they’re more like “if the cycle behaves like the last one” hypotheticals. Crypto loves to humble people who speak in certainty.
Technically, the latest price action did print a strong bottoming candle with a long lower wick, which often signals buyers stepping in aggressively at lower levels. SOL is currently sitting near the 0.382 Fibonacci level, tied to a high-volume zone between the S1 and S2 pivot points. The daily RSI is also sitting in oversold territory, which usually supports the case for at least a short-term bounce.
Still, the trend hasn’t flipped. SOL remains below its daily pivot and under the 200-day EMA, and that combination usually means the broader structure is still bearish. It’s more “accumulation vibes” than “bull market confirmed,” if we’re being honest.
Memecoin Mania Is Exploding, and It’s Warping the Narrative
While SOL itself has been struggling, the Solana memecoin machine has been doing what it always does: printing chaos at scale. Memecoin launchpads processed nearly $100 million in daily volume, and Dune data shows new token launches averaging around 30,000 per day this week. That number is so high it almost stops sounding real after you repeat it twice.
What’s funny (and kind of telling) is that memecoins have actually outperformed SOL lately. The memecoin sector market cap fell about 3.5% over the last 30 days to $30.2 billion, but SOL dropped around 8.5% over that same window. So even in a weak month, the meme market held up better than the chain’s native asset, which is not what you’d expect in a “healthy” cycle.
One of the clearest examples was Pippin (PIPPIN), which surged over 100% in a week and pushed past a $535 million market cap. Meanwhile, older memecoin giants like Dogecoin and Shiba Inu posted declines. That contrast says a lot: traders aren’t rotating into “safe memes,” they’re chasing the newest shiny thing.
The problem is, high memecoin activity is usually short-term speculation, not deep long-term conviction. So while the frenzy shows Solana’s throughput and user activity are strong, it also muddies the fundamentals. In other words, Solana can look like it’s thriving, even if half the demand is coming from pure degenerate trading.
The Big Question: Is SOL Undervalued or Just Lagging?
The most important takeaway is the divergence. Capital is flowing into Solana’s DeFi ecosystem even while SOL’s price action remains weak. That can be a sign of undervaluation, because sometimes markets punish the asset before they price in the fundamentals again.
When price diverges from on-chain growth, it often means long-term investors are still building positions quietly while short-term traders are distracted elsewhere. But the memecoin speculation complicates things, because it’s hard to separate “real conviction” from “temporary casino activity.” Still, stablecoin inflows and rising TVL are not nothing, and they tend to stick around longer than hype.
For now, SOL is bouncing near the mid-$80s, but the bigger battle is whether it can reclaim key trend levels and rebuild confidence above major resistance zones. Until then, the network might be winning… while the token keeps making investors sweat.