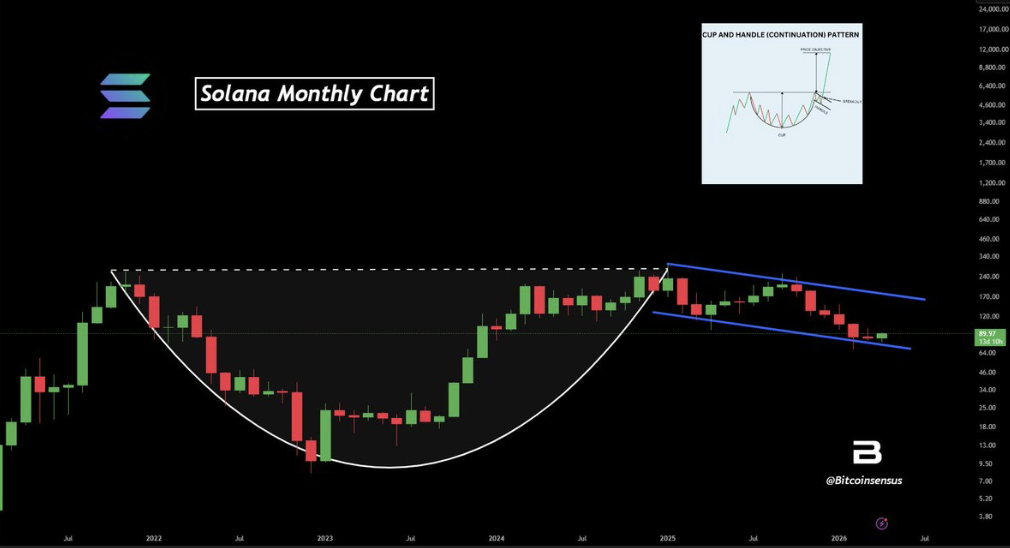
- Solana is forming a cup-and-handle pattern on the monthly timeframe
- Price remains in the handle phase between $70 support and $200 resistance
- A breakout above $240–$280 could trigger a larger upside move
Solana is starting to catch attention again, not because of a sudden breakout—but because of the structure forming underneath. On the monthly chart, it’s shaping into what looks like a classic cup-and-handle pattern. That’s usually bullish… but right now, it’s still incomplete.
Price is sitting inside the “handle” phase, moving sideways with a slight downward tilt. So yes, the setup is there—but the move? Not yet.
A Slow, Steady Recovery From the Bottom
If you zoom out, the bigger picture tells a pretty clear story. Solana peaked somewhere around $240 to $260 back in 2021, then went through a long, painful decline. It eventually bottomed out near $10–$12 in early 2023—basically the cycle low.
From there, things changed. Not overnight, but gradually. Price began to recover in a more controlled way, forming what looks like a rounded bottom. That kind of shape usually signals accumulation… not hype-driven buying, but steady positioning over time.
Eventually, SOL climbed back toward its previous highs, completing the “cup” part of the structure. That alone is significant.
The Handle Phase Keeps Things in Check
Since reaching that upper range again, Solana hasn’t broken out. Instead, it pulled back slightly and started forming the handle—a downward-sloping channel that reflects short-term pressure.
Right now, price is moving within that range. Resistance sits somewhere between $170 and $200, while support holds around $70 to $80. At the moment, SOL is trading closer to the lower end, hovering near $90… not exactly strong, but not breaking down either.
This phase tends to be quieter. Less volatility, more sideways movement. It’s not a reversal, just a pause—at least, that’s how it usually plays out.
Key Levels Will Decide the Next Move
So everything comes down to a few levels. On the upside, that descending channel resistance needs to break first. Then, the bigger test sits around $240 to $280—the “rim” of the cup. That’s the real breakout zone.
If SOL manages to push above that with strong momentum, the pattern opens up a much larger upside scenario. Some projections even point toward the $450–$550 range, based on the depth of the formation.
But that’s a big “if.”
On the downside, support around $70–$80 is critical. If that breaks, the structure weakens, and price could slide toward $60 or lower. That would delay the bullish setup, maybe significantly.
For Now, It’s a Waiting Game
At this stage, Solana is still in consolidation. The pattern is there, the structure looks promising… but the market hasn’t committed to a direction yet.
As long as support holds, there’s still a path higher. But until resistance breaks, it remains just that—a possibility.
So for now, traders are watching. Waiting for that move beyond the range that finally decides what comes next.