- Whale accumulation and rising volume suggest renewed confidence in SOL
- Leverage data highlights $136 as key support and $141–$146 as a critical resistance zone
- A confirmed daily breakout above $146 could unlock a move toward $168
Despite the wider uncertainty across crypto, large players appear to be warming back up to Solana. Whale activity around SOL has picked up again, with several million dollars in fresh buy-side positioning showing up on-chain. It’s a notable shift, especially with price still moving sideways rather than breaking out cleanly.
On January 9, whale tracker Onchain Lens reported that a single whale deposited roughly $8.09 million and placed a sizable buy order for SOL between $133.88 and $135. That kind of positioning suggests patience rather than panic. At the time of writing, SOL was trading near $140, up about 2.5% over the last 24 hours, quietly reclaiming momentum.
Volume and Participation Start to Heat Up
Alongside the whale activity, broader market participation is ticking higher. Trading volume jumped roughly 25% to $5.05 billion, a sign that interest is returning after a slower stretch. When volume expands alongside price holding steady or rising, it often points to accumulation happening under the surface.
Derivatives data backs that up. Coinglass metrics show traders leaning bullish, with more positions being built on the long side. Spot flow data also paints a constructive picture. Over the past 24 hours, exchanges recorded net outflows of around $1.3 million worth of SOL, typically interpreted as investors moving tokens off exchanges and into longer-term holding.
Leverage Clusters Reveal Key Battlegrounds
Looking deeper into leverage positioning, traders appear heavily stacked around specific price levels. On the downside, the $136 area stands out, where roughly $111.5 million in long-leveraged positions have been built. That suggests many traders expect that level to hold if price pulls back.
On the flip side, the $141.4 zone has also drawn attention. It represents an over-leveraged region for shorts, with about $84.6 million in short positions sitting there. Compared to the long side, interest is lower, but it still marks a potential area of volatility if price pushes through.
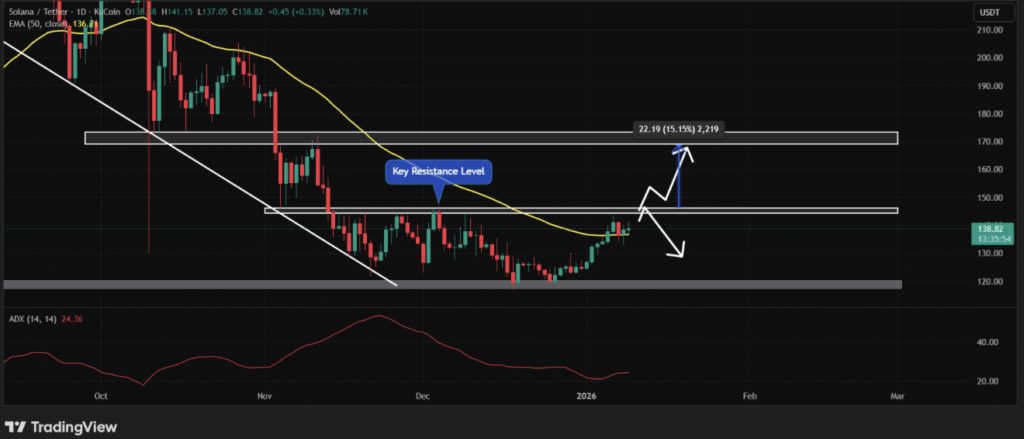
SOL Faces a Familiar Technical Hurdle
While sentiment is improving, price action still needs to do the heavy lifting. On the daily chart, SOL is once again approaching the $145.85 resistance level, a zone that’s been tested repeatedly since November 2025. Each attempt so far has failed, making this level hard to ignore.
If SOL manages to break above $146 and close a daily candle convincingly, the setup opens up. A move of roughly 15% toward the $168 area would become realistic in that scenario. On the other hand, failure at this level could trigger another pullback, repeating a pattern traders have seen more than once already.
From an indicator standpoint, conditions are improving. The Average Directional Index is sitting around 27.36, just above the key 25 threshold, hinting that trend strength is building. Meanwhile, the 50-day EMA continues to slope upward, suggesting the short-term trend remains constructive, at least for now.