- PENGU, BONK, and POPCAT have all bounced off key support levels and are showing early signs of bullish divergence on RSI and MACD.
- BONK and POPCAT both formed falling wedge patterns, hinting at potential breakouts if resistance zones are breached.
- PENGU still needs to clear the $0.012–$0.013 zone to confirm a bullish trend shift; until then, the broader downtrend remains in place.
It looks like the memecoin crowd isn’t done just yet. After some heavy dips, PENGU, BONK, and POPCAT are all showing signs they might be ready for another push higher. Each of them just tapped into key support zones and—though nothing’s confirmed yet—momentum could be shifting.
PENGU Trying to Wake Up
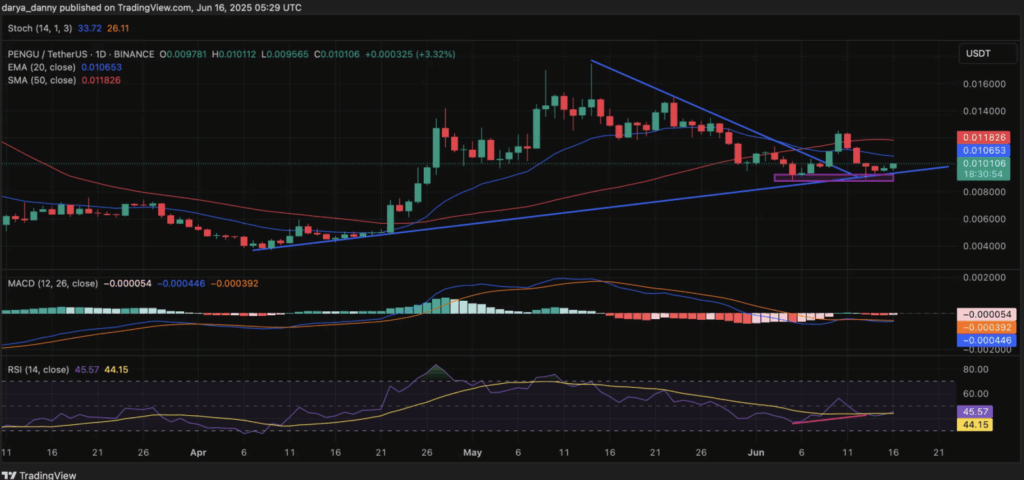
PENGU just bounced off a pretty decent support combo—its rising trendline and that horizontal zone between $0.0088 and $0.0090. You’ve also got a bit of a bullish divergence showing up on the RSI, and the MACD’s histogram is flattening, with a possible crossover creeping up.
Now, here’s the thing—PENGU is still stuck below its 20-day EMA and 50-day SMA, and that broader May downtrend hasn’t been broken yet. It hasn’t printed a proper higher high either, so bulls don’t have the upper hand yet. A solid break and close above $0.012–$0.013 would flip the script and finally get things looking bullish again.
BONK Eyes Wedge Breakout
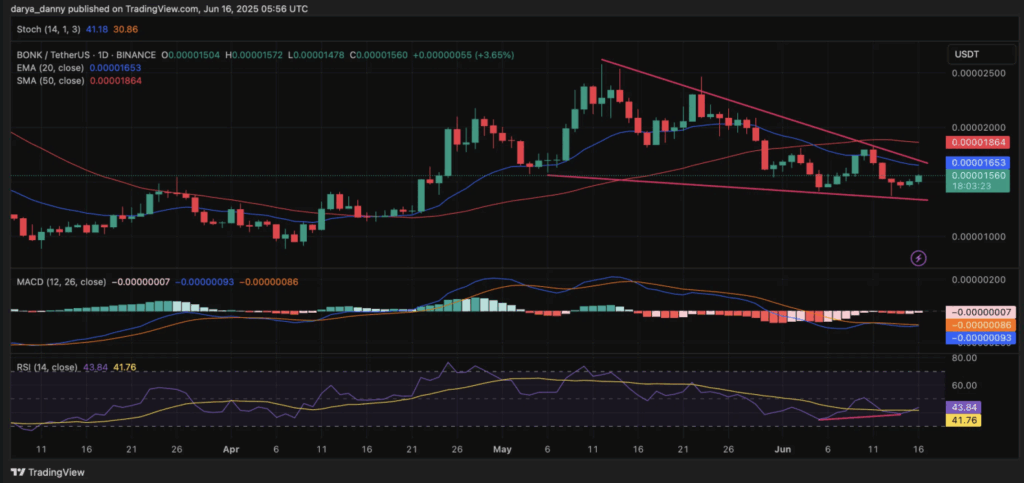
BONK is putting together a falling wedge on the daily chart—classic setup. The price just bounced off the lower wedge line, finding some support in the $0.00001370–$0.00001410 zone. The upper resistance trendline is hovering near $0.00001650–$0.00001680, which matches the 20-day EMA too. That could be the spark if bulls can push through.
There’s also a little RSI divergence going on—price made a lower low, but RSI didn’t, which usually means sellers are losing steam. MACD’s histogram is creeping back toward zero too, hinting we might see some bullish energy kick in.
If it does break out, keep an eye on $0.00001860 first—that lines up with the 50-day SMA and an old support level. After that, it’s $0.00002100 and maybe even $0.00002580 if this wedge really plays out.
POPCAT Wants In On the Action
POPCAT’s chart is kinda echoing BONK’s—it’s also formed a falling wedge and just tapped support between $0.29 and $0.31. The upper wedge resistance is up around $0.37–$0.38, which also happens to be where the 20-day EMA is chillin’.
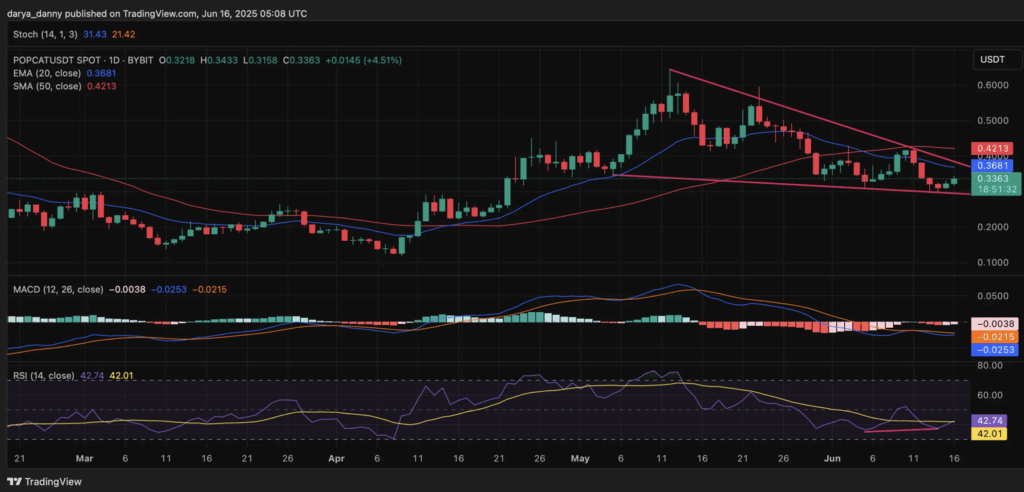
There’s a nice RSI divergence forming here too, plus MACD is slowly curling up. Nothing explosive yet, but it’s setting the stage.
If bulls can flip $0.42, that brings us to the 50-day SMA and a previous swing high. From there, if momentum really picks up, we could be talking $0.50—and even a run to $0.60–$0.65 if it pulls off the full wedge move.