
- Litecoin jumps over 10% in 24 hours as bullish momentum strengthens.
- LTC consolidates between Bollinger Bands while momentum indicators stay neutral.
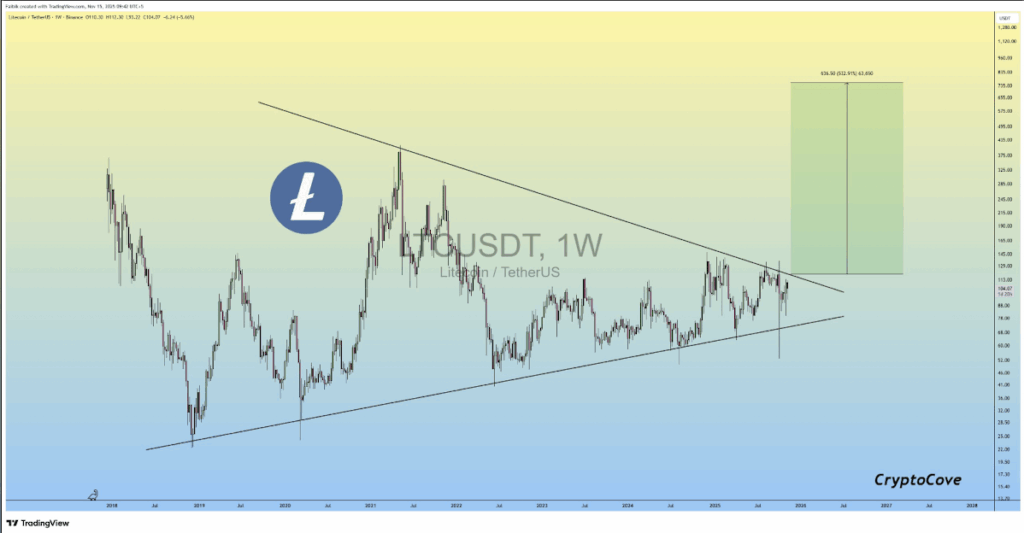
- A massive symmetrical triangle hints at a potential breakout toward the $636 zone.
Litecoin has been grinding its way upward, riding a wave of fresh bullish momentum that’s been rolling through the crypto market lately. In just the last 24 hours, LTC jumped about 10.56%, adding to a steady weekly gain of roughly 5.89%. The token now trades around $105.45, supported by a noticeable rise in volume — $1.34 billion in the past day alone, which is a solid 14.4% jump. Its market cap has climbed to $8.06 billion, hinting that investor interest is creeping back in, maybe quicker than some expected.
Consolidation Continues Before Litecoin’s Next Major Move
On the weekly chart, LTC is still moving inside a broad consolidation zone, bouncing between the Bollinger Bands with the middle band around $108 acting like a pivot point. Litecoin tested the upper band near $128 not long ago, but since then it’s drifted back toward the center, cooling off but not breaking structure. The lower band around $88 remains the crucial support level — the “don’t lose this or things get messy” kind of zone. Momentum signals are a bit mixed too: RSI is hovering around 50, showing no real strength but no weakness either, while the MACD histogram is slightly negative as the lines squeeze together. It’s classic consolidation behavior… calm before something bigger.
Symmetrical Triangle Points Toward a Massive Breakout
Crypto analyst Captain Faibik highlighted something pretty interesting on the higher timeframe: Litecoin has been forming a huge symmetrical triangle, the kind that takes years to fully compress. Higher lows are pushing up from below, lower highs pressing down from above — all squeezing price right toward the apex. This type of pattern usually means one thing: tightening pressure and heavy accumulation. The longer it coils, the stronger the expansion tends to be when the breakout finally happens.
LTC’s Long-Term Target Could Hit $636
The projection for this triangle is surprisingly large. Based on the structure, the potential breakout target sits up near $636 — a level far above current pricing, but still valid based on the triangle’s height. If LTC actually breaks out with momentum and follows through, the upside could be explosive. It’s a high-timeframe squeeze, the kind that rarely plays out quietly. Whether bulls can hold momentum long enough to get there is another question, but the setup itself is one of the more impressive long-term formations in the market right now.