
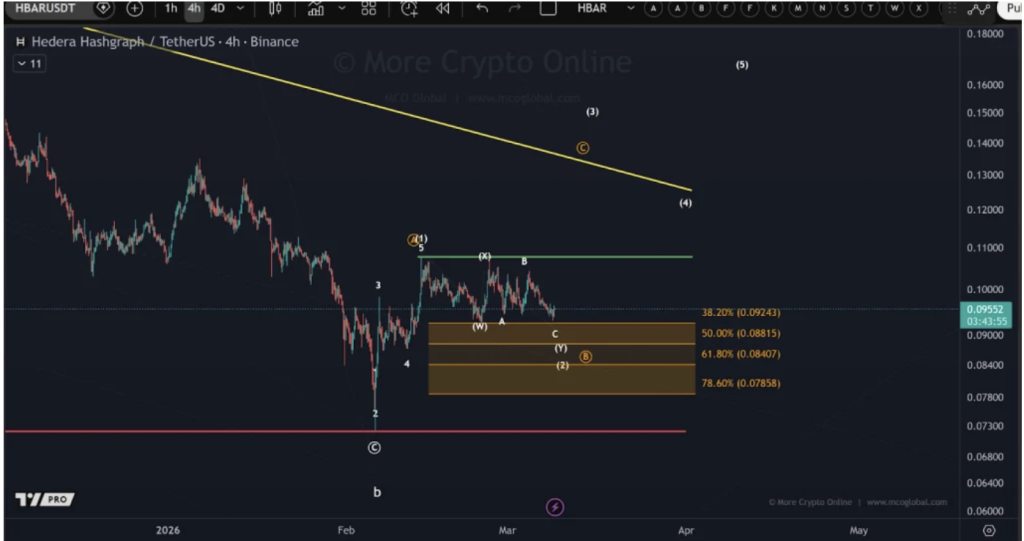
- Hedera appears to be forming a WXY corrective pattern, suggesting extended market consolidation.
- A breakout above $0.107 could signal early stabilization and potential recovery.
- If support near $0.093 fails, HBAR could revisit February’s lows.
Hedera’s price action lately has been… messy, to put it simply. The token appears to be forming what analysts call a WXY corrective pattern, a structure that usually signals prolonged consolidation rather than a clean directional move. According to data shared by More Crypto Online, the market isn’t trending strongly right now—it’s swinging back and forth inside a broader corrective phase.
For investors, that kind of structure often creates uncertainty. Prices move, yes, but without conviction. One day it looks like recovery is starting, the next day momentum fades again. That’s roughly where HBAR finds itself today.
At the moment, the chart still hasn’t confirmed a reliable bottom. Instead, the price continues drifting sideways within the WXY structure, suggesting the market is still working through its correction. And unfortunately for impatient traders, patterns like this can stretch on longer than expected.
Why the $0.107 Level Matters for HBAR
Analysts are focusing heavily on one level in particular: $0.107.
According to More Crypto Online, this area acts as a kind of trigger point for market sentiment. If HBAR manages to break decisively above it, that move could signal the start of a stabilization phase. In other words, buyers might finally begin reclaiming control.
A strong breakout there would also hint that the market is attempting to build a foundation for a broader recovery. Not necessarily an instant rally, but a shift in structure where bullish momentum could slowly start returning.
Until that happens, though, the WXY pattern remains intact. That means consolidation—and possibly more downside—still sits on the table.
Corrective structures often trap traders because they look like reversals before fading again. That’s why analysts are urging caution for now. Watching the key levels closely may matter more than predicting the next move.
Technical Indicators Suggest a Market at a Crossroads
Looking at TradingView data, Hedera’s broader trend still leans bearish despite the recent sideways movement. The asset is currently trading near $0.09465, which keeps it below the 20-day simple moving average around $0.09820.
The Bollinger Bands have also started tightening. When volatility compresses like that, it usually signals a breakout point approaching—though the direction isn’t always obvious beforehand.
Right now, HBAR is testing support around $0.09330, a level that traders are watching closely. If that support breaks, the market could easily revisit the February lows.
Momentum indicators add to the cautious tone. The MACD is showing signs that bearish pressure is weakening slightly, but both lines still remain below the zero mark. Earlier, there was a small bullish crossover, yet the histogram has since flattened, suggesting momentum is fading again.
For Hedera to truly shift its trend, analysts believe the token would need to reclaim $0.10309 resistance first. Without that move, the broader bearish structure remains in place.
For now, the chart tells a simple story: HBAR is still stuck inside a consolidation phase. Buyers haven’t taken control yet, and sellers haven’t fully pushed the market lower either.
The next breakout—whenever it arrives—will probably decide what comes next.