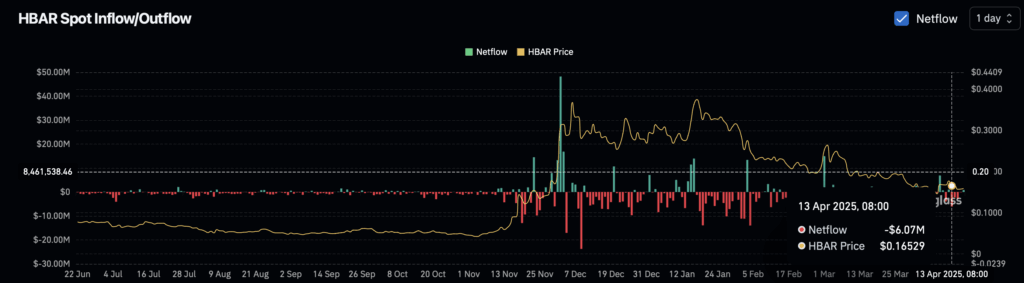
- HBAR has seen over $11 million in spot net outflows in just three days, signaling fading investor confidence and increasing downward pressure.
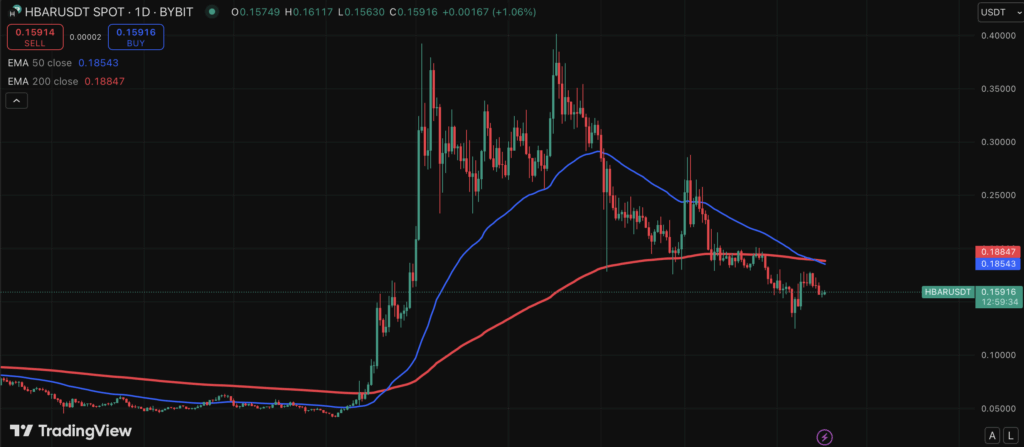
- A death cross just formed on the daily chart, while the RSI continues to fall — both indicators pointing to sustained bearish momentum.
- If the trend holds, HBAR could retest support around $0.11, though a shift in sentiment and volume could help it aim for the $0.17 resistance zone.
Things aren’t looking too hot for Hedera’s native token, HBAR, right now. After a pretty shaky few days, the coin’s caught in a swirl of heavy outflows, bearish technicals, and just… a general vibe of uncertainty. It’s not quite panic mode — but let’s just say the bulls are keeping quiet.
$11M Outflow in 3 Days? That’s Not Nothing.
Over the past three days, on-chain data shows more than $11 million in spot net outflows for HBAR. That’s a big number — and not a great one.
What does that mean in plain terms? People are selling or moving funds out of the market, and that’s usually tied to fading confidence. Investors aren’t betting on upside right now. They’re either waiting things out or looking for safer ground. Maybe both.
When capital flows out like this, especially across a few back-to-back sessions, it adds pressure. Prices don’t usually like it. And right now, HBAR is definitely feeling the heat.
The Death Cross Just Landed — And It’s a Classic Red Flag
If you’re into technicals, this one’s a biggie: HBAR just printed a death cross on the daily chart. For those less familiar — that’s when the 50-day moving average drops below the 200-day. It’s a signal that the trend has shifted from bullish to, well… not bullish.
The last time this happened for HBAR was November 2024 — and that didn’t end great either.
Traders tend to see a death cross and start closing long positions, or worse — opening shorts. That kind of action doesn’t just reflect bearish sentiment… it amplifies it.
RSI? Also Not Looking Great
The Relative Strength Index (RSI) — a momentum indicator that gauges buying pressure — is hovering around 42. Not terrible, but definitely not ideal.
Anything under 50 usually means the bulls are losing their grip. And with RSI continuing to slide, it shows that there’s just not enough demand to push the price higher right now. No real urgency to buy.
If it drops closer to 30, maybe we talk about oversold territory and bounce potential — but we’re not there yet. Right now, we’re just watching weakness unfold in real time.
What’s Next — Pain or Patience?
If this trend keeps rolling, analysts are pointing to $0.11 as the next big support level — the same zone HBAR hit back in late 2024. It held back then, but hey, that was then.
On the flip side, if something — anything — sparks a wave of buying, we could see an attempt to reclaim $0.17, which acted as resistance in the past. That’s the level to beat if bulls want to turn this ship around.
Final Thoughts
Right now, HBAR is looking fragile. With spot outflows stacking up, a death cross flashing red, and a sliding RSI, it’s clear the market’s leaning bearish. That doesn’t mean it’s game over — but it does mean caution is key.
For now, investors would be wise to stay sharp. Watch for signs of reversal. Watch volume. And maybe don’t dive in headfirst just yet.
Because in this kind of market? Patience might just save your portfolio.