
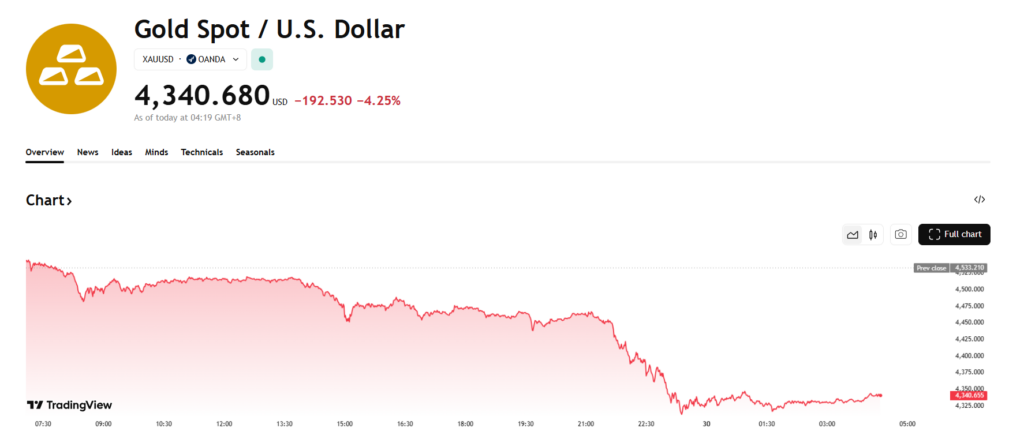
- Gold posted its largest one-day drop since October, falling over 4%.
- A repeat of prior selloff patterns points to downside risk near $4,040.
- Failure to hold former resistance raises the risk of deeper technical damage.
Spot gold saw a violent selloff on Monday, recording its largest one-day drop since October 21 and sending a clear warning signal to traders. That previous breakdown ultimately led to a nearly $495 decline over six sessions, and the current move is starting to echo that pattern. If a similar trajectory plays out, subtracting that prior loss from Friday’s high near $4,536 points to a potential downside target around $4,041 by early January, a level that would also push gold decisively below its 50-day moving average.
At around 19:17 GMT, XAUUSD was trading near $4,335, down roughly $198 on the day, or about 4.4%. Prices had bounced modestly off the intraday low near $4,302, but the recovery lacked conviction and did little to ease the broader technical damage.
Year-End Profit-Taking Likely Behind the Sudden Drop
The most likely explanation for the abrupt move is year-end positioning. As portfolios are squared and profits locked in, selling pressure can hit suddenly, especially in markets that have delivered strong gains. Gold trading, for many participants, is less about conviction and more about business, and businesses tend to realize profits before the calendar flips. That dynamic often catches retail traders off guard.

Weak Follow-Through From October Highs Raises Concern
One detail that stands out is how little upside gold managed to generate before rolling over. From the October 20 high near $4,381 to the late-December peak around $4,536, the advance totaled just $155. That modest gain was completely erased — and then some — in a single session. When a market gives back weeks of progress in one day, it often signals exhaustion rather than healthy consolidation.
Old Resistance Fails to Turn Into Support
Another red flag is gold’s move back below the previous breakout level near $4,381. There’s a long-standing rule in technical analysis that old resistance should become new support. If price fails to stabilize near that area, it suggests traders who bought the breakout are now trapped. That’s often when selling accelerates, as those positions look for any opportunity to exit.
Sellers Could Force a Deeper Reset
If sellers maintain control, attention shifts to lower value zones. A cluster of technical levels sits between roughly $4,211 and $4,171, where the 50% retracement and the 50-day moving average converge. Markets dominated by strong sellers tend to push weak longs into capitulation, especially as some attempt to average down and only worsen their exposure.
From Short-Term Trade to Long-Term Problem
This move also highlights the classic difference between analysis and execution. Fundamentals may not have changed, but price action has. There’s an old saying that it only takes one loss to turn a short-term trader into a long-term investor, and gold may now spend weeks working through the damage. If hedge funds are caught on the wrong side, margin calls could spill over into equity markets as positions are liquidated elsewhere. The next few sessions may prove decisive.