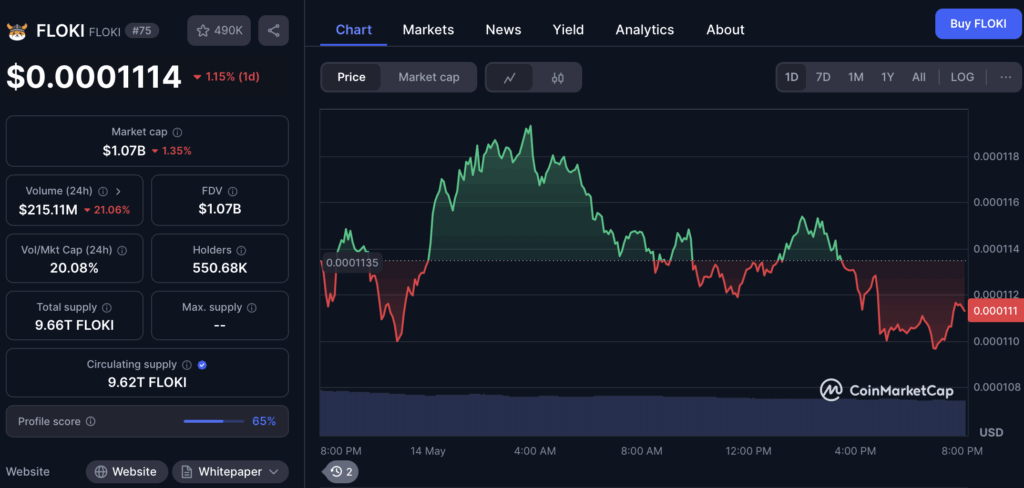
- FLOKI Bounces Back: FLOKI surged 107% in daily trading volume in May, spiking nearly 17% to $0.000123 before correcting to $0.000109. Despite the short-term pullback, the broader trend shows bullish momentum building as FLOKI breaks out of its months-long downtrend.
- Key Levels and Technicals: The $0.0000695 level, previously a bearish order block, has flipped to a bullish breaker block. Indicators like OBV and CMF signal strong buying pressure, with Fibonacci levels pointing to a 22% upside target between $0.000135 and $0.00014.
- Bitcoin’s Impact and Liquidity Zones: FLOKI’s next move may hinge on Bitcoin’s performance, with the $0.0001 and $0.000092–$0.000095 zones acting as key support. If those levels hold and Bitcoin remains strong, FLOKI could extend its rally toward the $0.00014 target.
FLOKI’s back in the game. After months of being stuck in the mud, the meme coin surged in May, catching traders’ attention with a 107% jump in daily trading volume. At its peak, FLOKI shot up nearly 17% to hit $0.000123 but has since pulled back around 10%, now hovering near $0.000109. But despite the rollercoaster ride, the bigger picture shows momentum is building, and key technical zones are coming into play.
Breaking the Downtrend – FLOKI Reverses Course
FLOKI had been stuck in a clear downtrend since mid-December 2024. That changed in April when it blasted through the $0.0000695 level, flipping what was once a bearish order block into a bullish breaker block. That move? It’s a classic sign of a potential reversal and could set the stage for more upside.

Technicals Paint a Bullish Picture
The indicators are backing up the bullish case. On-Balance Volume (OBV) has popped above its February highs – a level it couldn’t break in April. That’s a sign of strong buying pressure. Meanwhile, the Chaikin Money Flow (CMF) is solidly in positive territory at +0.05, signaling consistent capital inflows.
Fibonacci retracement levels are also pointing to potential targets. The next big one? The 61.8% retracement zone between $0.000135 and $0.00014. If FLOKI can hold its current momentum, there’s a 22% upside from current levels. Bulls are definitely eyeing that zone.
Liquidity Zones to Watch
But it won’t be a straight shot to higher prices. Recent liquidity data shows that the $0.000107 region has been a hotbed for liquidation activity, with a ton of positions getting wiped out over the last three months. That’s partly why we saw the recent surge and pullback.
A look at the 1-week liquidation heatmap reveals more trouble spots – the $0.0001 mark and the $0.000092–$0.000095 range are packed with liquidation clusters. If price dips back into those zones, it could shake out some weak hands before making another move higher.
The Bitcoin Effect – FLOKI’s Fate Tied to BTC
Let’s not forget the elephant in the room – Bitcoin. FLOKI’s next move is likely tied to what BTC does next. If Bitcoin keeps climbing, it could give FLOKI the fuel to push toward that $0.00014 target. But if Bitcoin stumbles, FLOKI could get dragged down with it, especially if confidence across the crypto market takes a hit.
The Bottom Line – Is FLOKI Ready to Fly?
For now, the key support zones to watch are $0.0001 and $0.000092–$0.000095. If those levels hold and the bullish structure stays intact, FLOKI could be gearing up for another 22% run to the $0.000135–$0.00014 range. But with liquidity clusters looming and Bitcoin acting as a wild card, traders should stay nimble – because in the wild world of crypto, anything can happen next.


