- A double bottom pattern around $0.1467 and bullish indicators like MACD and RSI are hinting at a potential DOGE breakout.
- Whale accumulation is rising, while smaller holders pull back—often a signal of institutional positioning.
- DOGE faces resistance near $0.176 and $0.259, but a clear break above $0.21 could open a path toward $0.36.
Dogecoin’s trying to shake off the chop and crawl its way back up, even if it’s been slow goin’. Over the past week, DOGE has managed to climb about 2.8%, which ain’t bad, all things considered. But it’s still struggling to break past that sticky resistance zone in the high $0.17s.
The price action’s been bouncing between cautious optimism and mild hesitation. Nothing too explosive yet, but there’s some life in it—and one chart pattern in particular has traders watching close.
That Double Bottom Might Be the Key
Market analyst Tom Tucker spotted something interesting—he flagged a double bottom forming on the daily DOGE/USDT chart. And if this setup plays out, we might be looking at a legit reversal.
It all started back on April 7, when DOGE dipped to $0.1299 before jumping all the way up to $0.25. Then again on June 22, it tapped $0.1437 and bounced. Two decent lows, both pretty close to the same area, forming the shape traders call a double bottom. The neckline? That’s sitting up at $0.2596.
Patterns like this don’t always guarantee anything, but they do hint at growing buyer interest. That support zone near $0.1467 has held strong more than once, and buyers seem to keep stepping in there.
Indicators Are Flashing Green—Sort Of
Looking under the hood, momentum is starting to lean bullish. The RSI is climbing—now just under 50—and that’s usually a sign bears are losing their grip. At the same time, MACD just flashed a bullish crossover. That means the MACD line popped above the signal line, and traders usually read that as the start of an uptrend.
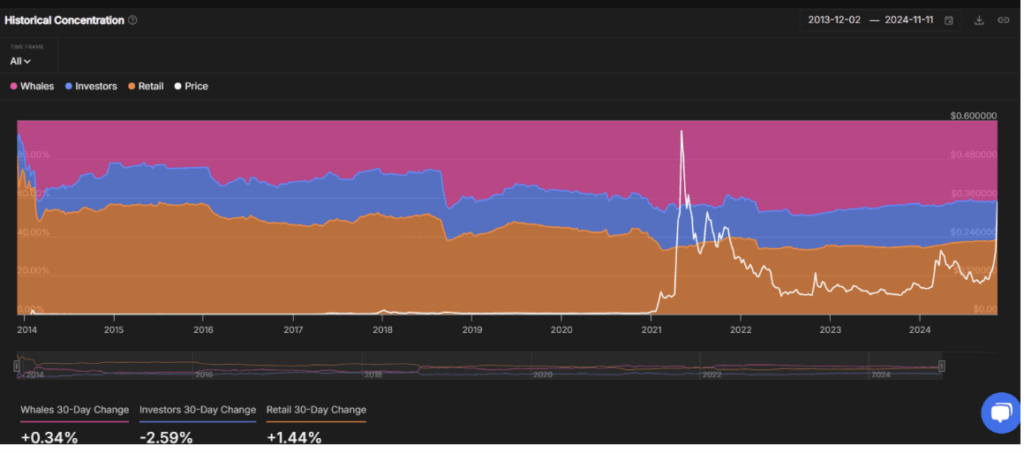
But here’s the part that’s really interesting: whales are quietly loading up. Over the past month, large DOGE holders have upped their share by 0.34%. Smaller holders, meanwhile, have backed off. That usually signals some smart money is quietly positioning.
Resistance Ahead, But Room to Run
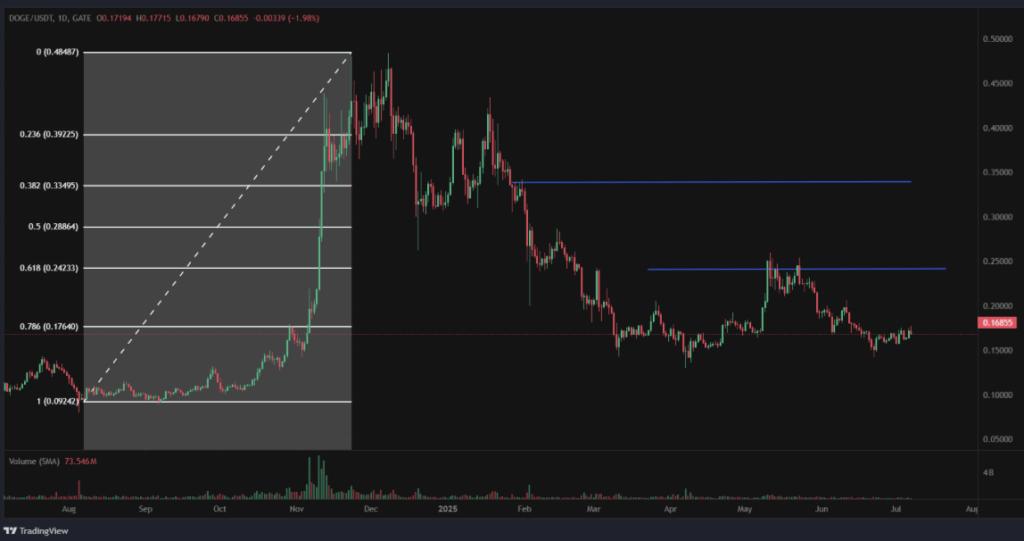
DOGE is currently hovering just below the 0.786 Fib level at $0.1764—so yeah, that’s resistance #1. But the big test will come at $0.2596, the neckline of the double bottom. That’s not far from the 0.618 Fib at $0.2423.
If price can push through that zone? Next likely stops are $0.2886 (0.5 Fib) and $0.3349 (0.382 Fib)—both solid targets from the last big Dogecoin run.
Tucker thinks the whole pattern stays valid as long as DOGE holds the line at $0.1467. From the current price of around $0.1681, a move to $0.2596 would be a ~54% pump. Not too shabby.
Where the Supply Is Hiding
The URPD chart (from Glassnode) gives us a peek at where folks bought their DOGE—and where they might be ready to sell. A lot of supply was last moved near $0.1774, $0.2069, and $0.3622. These zones could bring in some resistance if DOGE starts pushing up.
Interestingly, the biggest pile of DOGE is still sitting at $0.0739. That’s where 20% of the whole supply changed hands. But more immediately? That $0.177 level is a key one—8.94% of the supply was bought there, so it might act like a ceiling.
If DOGE does manage to blast through $0.21 cleanly, though, the road to $0.36 starts to open up.