BlockNews
FOLLOW ON X
  • BITCOIN
  • CRYPTO
    • ETHEREUM
    • RIPPLE XRP
    • SOLANA
    • CARDANO
    • BINANCE BNB
    • DOGECOIN
    • TRON
    • SUI
    • CHAINLINK
    • LITECOIN
  • FINANCE
  • POLITICS
  • MEMECOINS
  • NFT
  • OPINION
No Result
View All Result
BlockNews
  • BITCOIN
  • CRYPTO
    • ETHEREUM
    • RIPPLE XRP
    • SOLANA
    • CARDANO
    • BINANCE BNB
    • DOGECOIN
    • TRON
    • SUI
    • CHAINLINK
    • LITECOIN
  • FINANCE
  • POLITICS
  • MEMECOINS
  • NFT
  • OPINION
No Result
View All Result
BlockNews
Home CRYPTO CHAINLINK

Chainlink Technical Analysis: LINK Compression Pattern Signals Potential Expansion Move

Gary Ponce by Gary Ponce
February 15, 2026
in CHAINLINK, CRYPTO, FINANCE, OPINION
Share on XShare in TelegramShare on Reddit
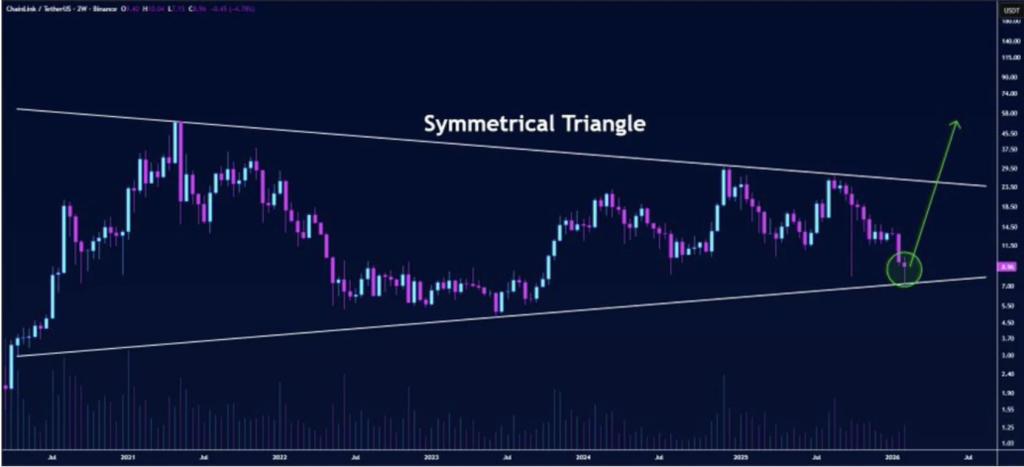
  • LINK is bouncing from the lower boundary of a large 2-week symmetrical triangle that has held as support multiple times in past years.
  • The triangle has been forming since the 2021 peak, with tightening price action and declining volume signaling late-stage compression.
  • A confirmed 2-week close above the descending trendline could open targets near $45–$50, while a break below rising support would turn the setup bearish.

Chainlink (LINK) is back on traders’ radar again, mostly because the chart is starting to look “alive” after months of slow, tight movement. On Feb. 14, crypto analyst Butterfly pointed out that LINK is bouncing off the lower boundary of a large symmetrical triangle on the 2-week timeframe. That’s not just some random line on a chart either, it’s a level that has acted as a reliable base for buyers multiple times over the past few years.

And when a support zone gets defended again and again, it usually means one thing: people are quietly accumulating, even when the timeline is bored.

LINK’s Long Triangle Has Been Building Since the 2021 Peak

This symmetrical triangle structure has been forming ever since Chainlink topped out during the 2021 bull cycle. After that peak, LINK didn’t collapse into nothing, instead it entered a long consolidation phase, the kind that slowly compresses price action until it feels like the market is being squeezed from both sides.

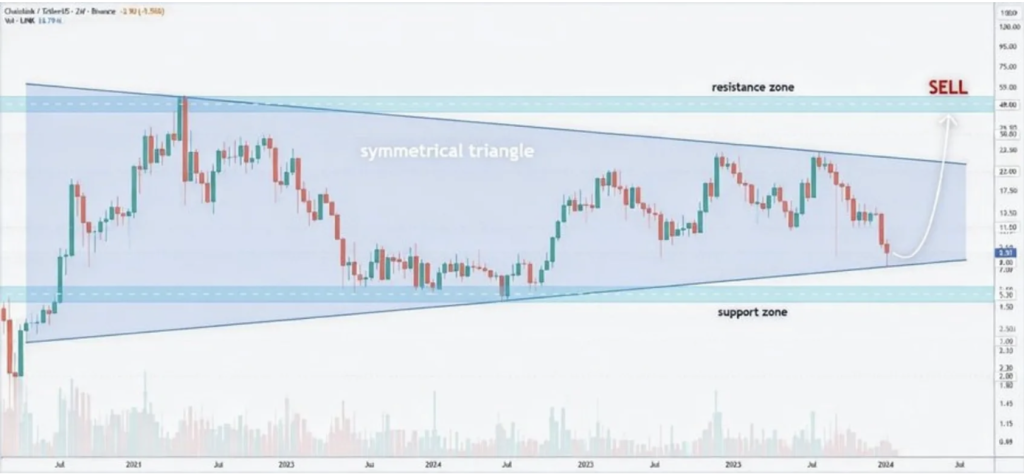
The pattern is pretty clean. You can see lower highs forming over time, while the lows keep rising, which creates that tightening “coil” effect. The upper trendline connects major swing highs from 2021, 2024, and 2025, while the lower rising boundary connects the corrective lows from 2022 and 2023. It’s basically the chart version of two forces leaning into each other, neither one fully winning yet.

This kind of behavior usually signals a balanced market. Bulls push up, sellers slap it down. Bears push lower, buyers step in and absorb it. Over and over. Not exciting, but it’s the type of structure that often shows up right before a bigger move, especially on higher timeframes.

Link

Compression Usually Leads to Expansion, Eventually

Symmetrical triangles are often treated as volatility compression patterns. The closer price gets to the apex, the more compact the movement becomes, and the more “loaded” the chart starts to feel. In LINK’s case, it looks like the pattern is reaching its final stage, which is the part where things can start moving fast, sometimes uncomfortably fast.

Depth and volume analysis on the chart also points to a gradual reduction in volume inside the triangle, which is pretty typical as the structure matures. Volume tends to dry up during compression because fewer traders want to take big bets in a tight range. Then, when the breakout finally happens, volume comes back like a flood.

Butterfly’s projection suggests that if buyers can break through the descending resistance line, LINK could run toward the $45 to $50 region first. That would be the “first major target” type of move, not necessarily the end of the story.

The measured move of the triangle, based on the height from the 2021 high down to the 2022 low, also implies the potential for something bigger. Butterfly even floated the idea of a move toward $60 if bulls fully take control. Still, none of this matters unless the breakout actually confirms, and crypto loves to fake people out right before the real move.

Breakout Confirmation Is Still the Whole Game

Another analyst, Alex Choi, highlighted a similar view. He noted that LINK is approaching the apex of the triangle while sitting near the lower boundary, an area with historically strong bounce potential. Basically, this is the zone buyers have defended repeatedly, and that repeat behavior is what makes it important.

From here, the trigger is simple, but not easy. Bulls need a clean close above the descending trendline on a 2-week candle, not just a quick wick through it. That type of close would be a stronger signal that the trend is shifting upward, and it would likely pull more traders into the trade.

On the other hand, if LINK breaks below the rising support line, that would be a bearish signal and could open the door to a deeper retracement zone. It wouldn’t automatically kill the long-term structure, but it would delay any breakout narrative and probably reset expectations for a while.

For now, Chainlink is doing what it’s supposed to do in a compression pattern: holding key support, tightening up, and forcing the market to make a decision soon. The only question is which side gets the final say.

Disclaimer: BlockNews provides independent reporting on crypto, blockchain, and digital finance. All content is for informational purposes only and does not constitute financial advice. Readers should do their own research before making investment decisions. Some articles may use AI tools to assist in drafting, but every piece is reviewed and edited by our editorial team of experienced crypto writers and analysts before publication.
Tags: AltcoinsChainlinkCrypto AnalysisLINKprice actionTechnicals
TweetShareShare
Gary Ponce

Gary Ponce

Gary has been active in the crypto space since 2019, developing hands-on experience in trading, airdrop hunting, and identifying emerging narratives in low-cap tokens. For over four years, he has contributed research and editorial content with Aiur Labs and BlockNews, focusing on market analysis and community insights. His work reflects both transparency and independent reporting, with an emphasis on simplifying complex ideas for readers. Gary is a long-term believer in Bitcoin, Sui, Hype, Litecoin, XRP, AVAX, and select meme tokens, combining personal trading knowledge with professional editorial standards.

DON'T MISS THESE! HOT OFF THE PRESS

DOGE Nears $0.15 While PEPE Battles Trendline Resistance Amid Crypto Market Revival
BITCOIN

DOGE Nears $0.15 While PEPE Battles Trendline Resistance Amid Crypto Market Revival

February 15, 2026
Solana Technical Outlook: Crowded Shorts Build as $80 Becomes Key Battleground
CRYPTO

Solana Technical Outlook: Crowded Shorts Build as $80 Becomes Key Battleground

February 15, 2026
CRYPTO

Solana Down 31% in 2026 Despite Record TVL and Exploding Memecoin Volume

February 15, 2026
XRP Price Prediction: Analyst Says 3 Lines Point to $50 – Here Is the Long-Term Channel Setup
CRYPTO

XRP Price Prediction: Analyst Says 3 Lines Point to $50 – Here Is the Long-Term Channel Setup

February 15, 2026
XRP Monthly Chart Signals Major Breakout Setup – Here Is Why $0.60 and $0.90 Matter
CRYPTO

XRP Monthly Chart Signals Major Breakout Setup – Here Is Why $0.60 and $0.90 Matter

February 15, 2026
Ethereum Reclaims $2,000 but Whales Signal Indecision – Here Is Why ETH Is Stuck
CRYPTO

Ethereum Reclaims $2,000 but Whales Signal Indecision – Here Is Why ETH Is Stuck

February 15, 2026
Load More

Related News

Chainlink Technical Analysis: LINK Compression Pattern Signals Potential Expansion Move

Chainlink Technical Analysis: LINK Compression Pattern Signals Potential Expansion Move

February 15, 2026
DOGE Nears $0.15 While PEPE Battles Trendline Resistance Amid Crypto Market Revival

DOGE Nears $0.15 While PEPE Battles Trendline Resistance Amid Crypto Market Revival

February 15, 2026
Solana Technical Outlook: Crowded Shorts Build as $80 Becomes Key Battleground

Solana Technical Outlook: Crowded Shorts Build as $80 Becomes Key Battleground

February 15, 2026

Solana Down 31% in 2026 Despite Record TVL and Exploding Memecoin Volume

February 15, 2026
XRP Price Prediction: Analyst Says 3 Lines Point to $50 – Here Is the Long-Term Channel Setup

XRP Price Prediction: Analyst Says 3 Lines Point to $50 – Here Is the Long-Term Channel Setup

February 15, 2026
Twitter Telegram Threads

BLOCKNEWS.COM

BlockNews is your premier source for real-time cryptocurrency, blockchain, political and financial market news.

Stay ahead of the herd with BlockNews

RESOURCES

  • About Us
  • Contact Us
  • Editorial Policies
  • Terms and Conditions
  • Privacy Policy
  • Sitemap

DISCLOSURES AND POLICIES

BlockNews provides independent reporting on crypto, blockchain, and digital finance. Content is for informational purposes only and does not constitute financial advice. Sponsored material is always disclosed. By using this site, you agree to our Terms and Conditions and Privacy Policy.

© 2025 BlockNews

No Result
View All Result
  • HOME
  • BITCOIN
  • CRYPTO
    • ETHEREUM
    • RIPPLE XRP
    • SOLANA
    • CARDANO
    • BINANCE BNB
    • DOGECOIN
    • TRON
    • LITECOIN
    • CHAINLINK
    • SUI
  • MEMECOINS
  • POLITICS
  • FINANCE
  • NFT
  • DEFI
  • GUIDES

© 2025 BlockNews