
- BNB adoption is rising, with a record 539M unique addresses and 4M transactions in 24 hours, showing strong network activity despite a market dip.
- Charts suggest a bullish breakout, as BNB trades in a historic support zone forming a bullish triangle, with potential to rally 42% to $793.
- Spot and futures data show accumulation, with $21M in recent buys and a positive funding rate, signaling growing bullish sentiment among traders.
The market hasn’t exactly been kind to bulls over the last 24 hours — down 3.57% overall. But beneath the red, there’s something quietly brewing with Binance Coin (BNB), and it’s catching attention.
Some analysts are pointing to large holders as the potential trigger behind this move, hinting that we could see a buyback wave kick in soon. If that happens, BNB might not just recover — it could lead the charge.
BNB Adoption Just Hit a New High
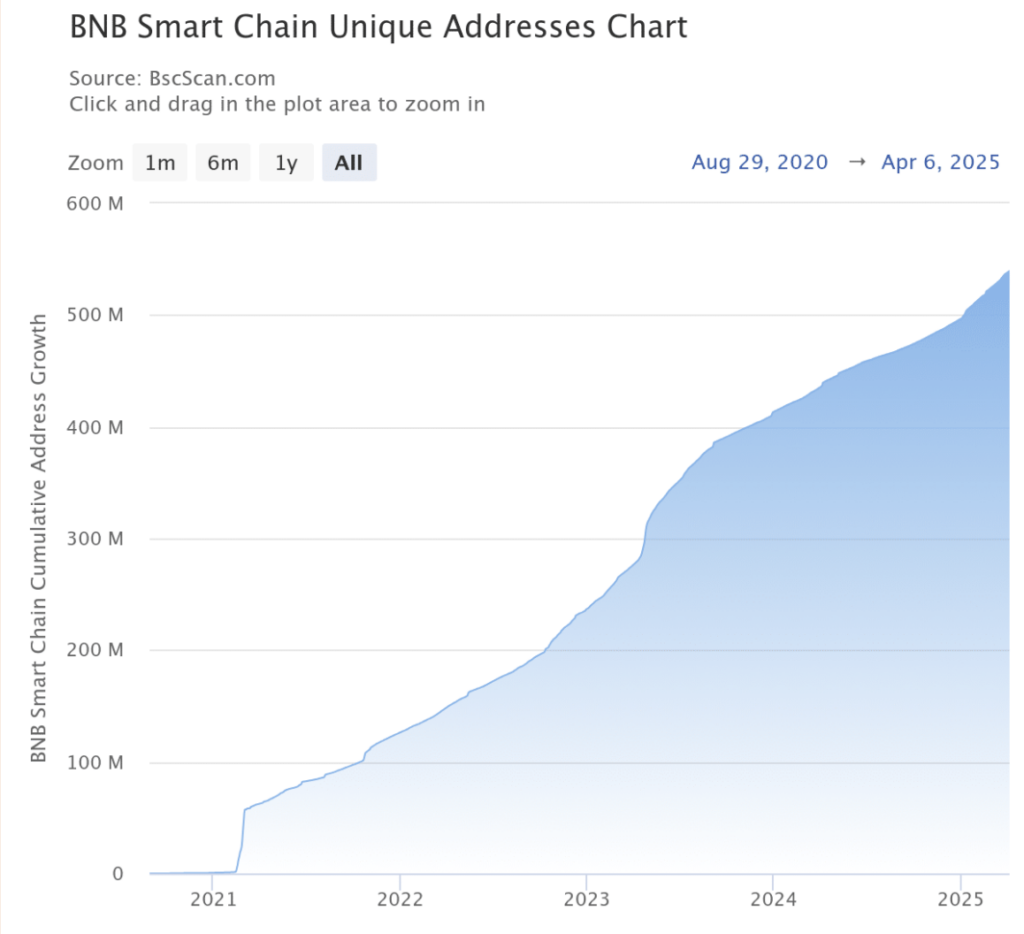
Despite the broader market slide, BNB adoption is quietly growing. According to BscScan, unique addresses interacting with the BNB Smart Chain surged to a record 539 million, up 268,000 from just the day before.
Now, keep in mind — these are new addresses, folks interacting with BNB for the first time (either sending or receiving). It’s not a perfect measure of new users, but it’s a solid signal of growing engagement.
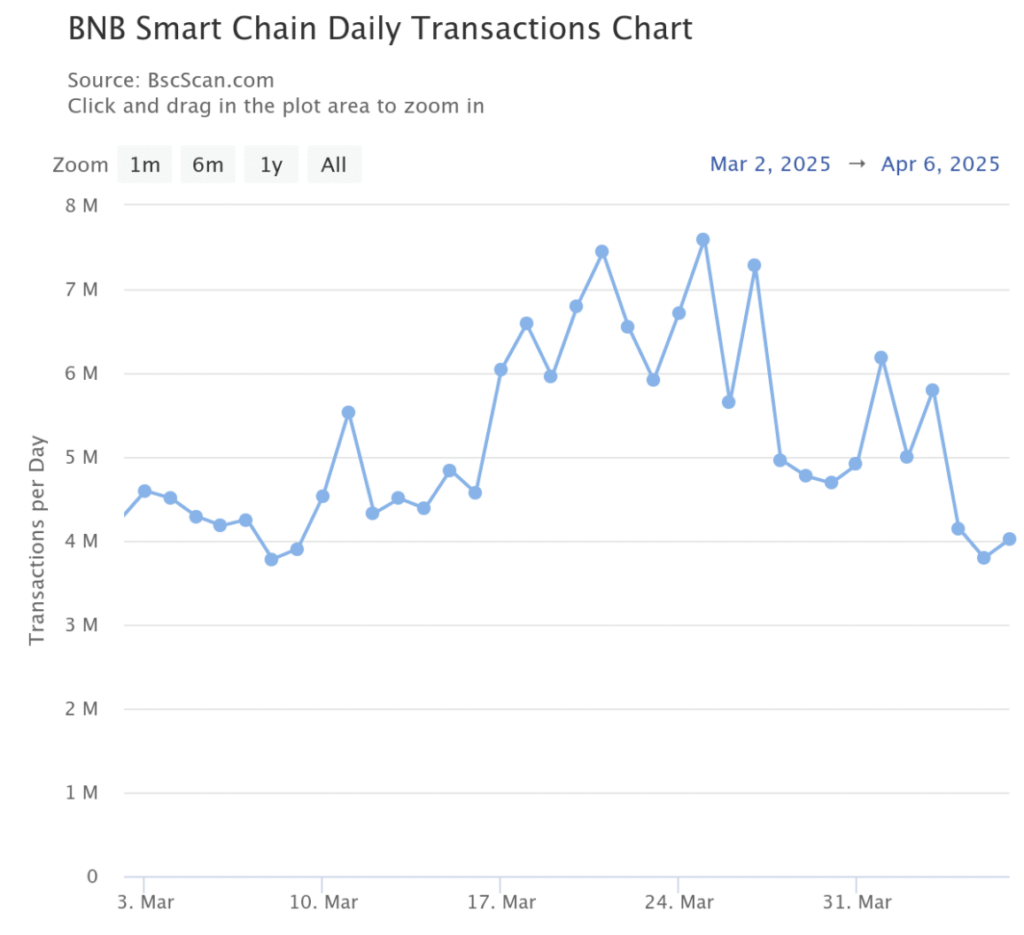
And it’s not just addresses. Transactions also jumped, hitting the 4 million mark in the same 24-hour window. That kind of activity usually points to rising confidence, even if the price action’s been a little rocky.
Charts Show BNB Entering a Key Buy Zone
AMBCrypto notes that BNB has entered a historically strong support zone on the daily chart — and it’s starting to form a bullish triangle. If the pattern plays out, we could be looking at a serious price push in the near future.
The last two times BNB traded in this same area? Prices spiked shortly after.
But—there’s always a “but”—those moves also triggered liquidity sweeps. Long wicks down, followed by rapid recoveries. That’s usually the market flushing out weak hands — folks with tight stop-losses who can’t stomach the drop — before big buyers swoop in.
So yeah, if you’re in, don’t blink.
Whale Accumulation Is Picking Up
Meanwhile, spot data shows clear accumulation. In the past 24 hours alone, traders picked up $9.83 million worth of BNB as the price dipped — bringing the three-day total to $21.04 million.
Big buys on red days? That’s usually not retail. That’s whales.
And over in derivatives, the sentiment’s leaning bullish too. The Open Interest (OI)-Weighted Funding Rate is still sitting in the green — 0.0020% as of writing. That’s a small number, sure, but still a positive signal. When this rate is above 0%, it suggests long positions are dominating, and traders are willing to pay extra to stay bullish.
What Comes Next?
If this accumulation wave keeps gaining steam, BNB could rally toward $793 — a level it hasn’t touched since December 2024. That’s about 42% upside from current prices.
But for that to happen, two things need to line up:
- Continued buying support from both spot and futures markets.
- A breakout from the current descending resistance line.
If both click into place, it won’t just be a bounce — it might be the start of a bigger trend reversal.
Bottom line? BNB is back on the radar. Traders are buying the dip, whales are circling, and the charts are lining up. That doesn’t mean it’s a sure thing — but it’s definitely one to watch.