- BNB trades around $705 with a confirmed breakout above $690, targeting $1,000 in the long run.
- Strong volume and technical setups support sustained bullish momentum, with $720 next in sight.
- AltWolf and Holthaus both point to prolonged accumulation and structure backing the rally.
BNB’s showing some serious heat right now. Price action’s popping off, driven by rising volume, strong momentum, and chart setups that even seasoned analysts are watching closely. At the time of writing, BNB’s hovering near $705—flirting with levels we haven’t seen since early 2024. A larger bullish structure seems to be unfolding on the daily, and honestly? Some folks are already eyeing that $1,000 mark again. It’s ambitious, but not out of reach if this momentum keeps up.
Breakout Confirmed: $699 Just the Beginning?
Analyst Bob Holthaus dropped a long setup on the BNB/USDT 1-hour chart over on Binance Perps, entering around $684.44. BNB moved sideways for a bit, building what he called an “accumulation box,” before finally pushing above that $690 resistance. The breakout hit its first target at $699—clean and quick. Volume spiked right as price moved, with a sharp reaction candle closing above $690. That kind of move usually brings in follow-up trades. This one did.
Trade management was tight—partials taken at $699, stops moved to breakeven. Simple stuff but solid execution. Holthaus noted next resistance could be up around $720, though honestly, the trade already looks like a win. The zones were laid out with precision, which gave it structure, but the real kicker was the volume confirmation—it’s what turned this from “possible breakout” to “yeah, this thing’s going.”
High-Volume Breakout Pushes Past $700
Data from BraveNewCoin shows a clean 2.03% bump in BNB’s price over 24 hours, landing it at $704.22. It started the session in chop-mode near $685, then just exploded above $695. Volume came with it—$1.55 billion traded in that window. That’s no joke. Retail, institutions, everyone seemed to be watching the same breakout unfold. It’s not just a price move—it’s a market signal.
BNB’s now got a $102.6 billion market cap, reclaiming its spot as the fifth-largest crypto out there. What’s more, it’s holding above $704 going into the next session, which suggests the bulls aren’t done yet. Staying above $700 could be a short-term psychological win, but if momentum and volume stick around? Multi-month highs might be back on the table.
All Eyes on $1,000—Technical Indicators Say It’s Possible
Over on TradingView, BNB printed another higher high—this time touching $705.23. That’s a 1.91% daily climb, and it’s part of an ongoing uptrend that just keeps building. MACD is firmly bullish: histogram’s widening at 4.76, and the signal line hasn’t even flinched. RSI’s up at 71.49, so momentum’s strong, but it hasn’t quite hit overbought territory yet. There’s gas left in the tank.
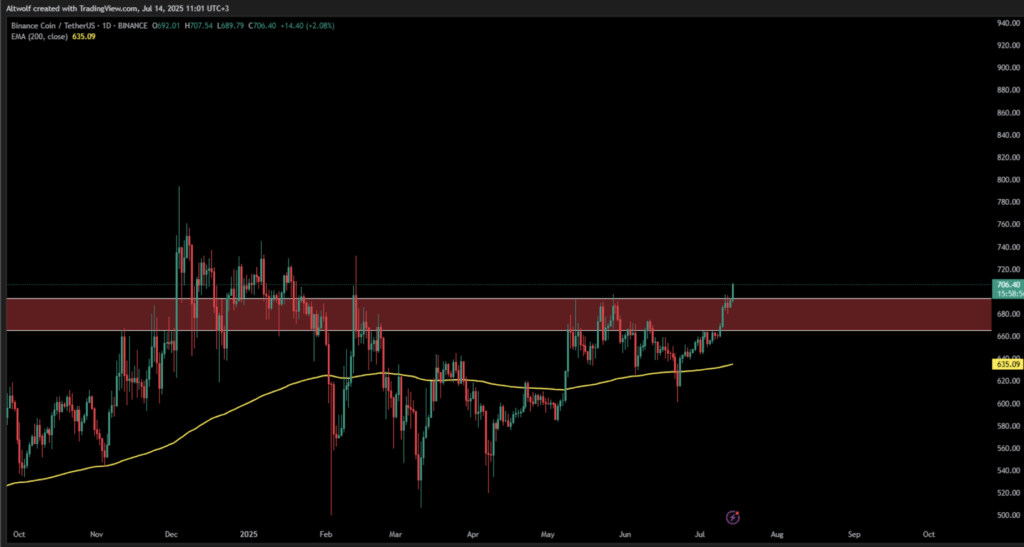
Chart analysis from AltWolf adds some color too. He posted a BNB/USDT snapshot showing a breakout above the $660–$700 zone—a resistance area that’s been tough to crack since late last year. That red box on the chart? Gone. The current candle broke out clean and full-bodied, ending that string of lower highs that kept bulls nervous. The 200-day EMA at $635 played a solid support role heading into the move.
AltWolf noted that BNB’s been building higher lows for a while now—classic accumulation. With this breakout in the books, he’s calling for a macro target near $1,000. Yeah, it’s a big number, but it lines up with round-number resistance and past breakout cycles. If BNB can stay comfy above $700, we might just be looking at the start of something long and loud.